Why the MBR vs CAS Question Hits Differently in Kindred
For a food and beverage plant in the Kindred, North Dakota industrial corridor in 2026, the MBR vs conventional activated sludge decision is not a generic technology preference — it is a localized calculation driven by winter mixed-liquor temperatures in the 8–12 °C range, seasonal sugar-beet and dairy whey spikes, and the pretreatment envelope enforced by NDDEQ Chapter 33.1-16-02 and the Cass Rural Water / City of Kindred utility pretreatment program. Both technologies clear the baseline BOD 300 mg/L / TSS 300 mg/L sewer-discharge envelope that most Kindred F&B plants tie to, but they do it with very different safety margins on the days that actually drive permit excursions.
The Cass County / Fargo-Moorhead corridor runs a heavy food and beverage mix: sugar beet processing from the American Crystal supply chain, dairy operations stretching west toward the Cass-Clay footprint, breweries and malt houses serving the regional craft market, and bottling lines tied to the Fargo-Cass distribution cluster. Those streams carry high sugar, color, and FOG loads, and they shock — a beet campaign or a whey spill can push influent BOD above 4,000 mg/L in a single shift. NDDEQ industrial discharge limits and Cass Rural Water pretreatment limits are the actual compliance targets; the technology is just a means to clear them with margin. For a full breakdown of how submerged membrane modules change the operating envelope, the 2026 MBR vs CAS engineering comparison lays out the parameter ranges side by side.
How Conventional Activated Sludge Treats F&B Wastewater
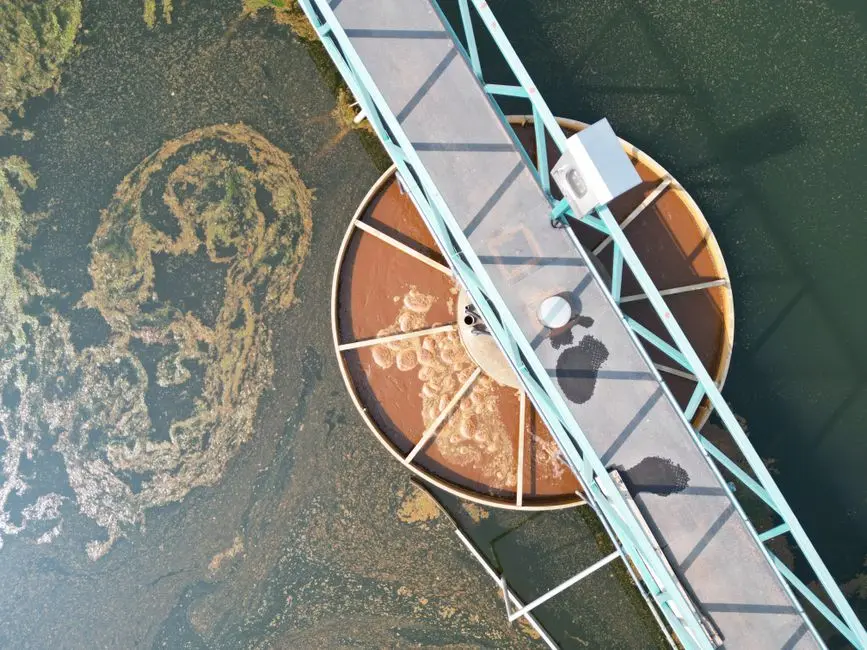
Conventional activated sludge treats F&B wastewater through a fixed sequence: equalization, primary clarification (or a DAF unit on FOG-heavy streams), an aeration basin operated at roughly 3,000 mg/L MLSS, a secondary clarifier, and disinfection. Heterotrophic bacteria oxidize the bulk of carbonaceous BOD in the aeration basin, and the secondary clarifier separates the mixed liquor from the clarified supernatant by gravity settling. Settled sludge returns as RAS; a controlled fraction is wasted as WAS for dewatering on a plate-and-frame filter press.
The secondary clarifier is the single point of failure. On a beverage stream, pilot data show that about 63% of influent COD is non-settleable (Idris et al., 2021), so clarifier performance is the largest source of effluent variability. CAS advantages are real and well documented: lowest CAPEX of any biological option, simplest operations, and a century of design data on steady brewery and bottling streams. The disadvantages are equally well known: a clarifier footprint typically 2–3× the area of an equivalent MBR cassette, and acute sensitivity to BOD shocks that wash floc out of the clarifier and push effluent TSS above permit. Routine RAS and WAS pump maintenance matters more in CAS than in MBR; the RAS and WAS pump maintenance schedule is a useful operating reference.
How an MBR Treats the Same F&B Wastewater
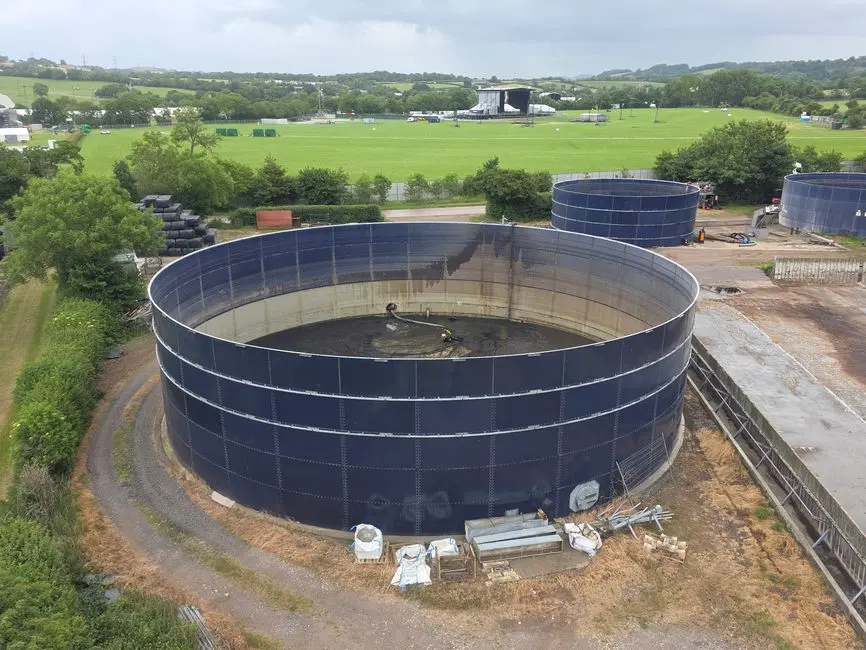
An MBR is best understood as a clarifier replacement inside the existing aeration basin, not a wholesale process change. A submerged PVDF membrane module with 0.1–0.2 μm pore size sits inside the activated sludge reactor and performs solids–liquid separation by physical filtration rather than gravity settling, which is why the secondary clarifier can be deleted. The membranes are typically packaged as a flat-sheet cassette, and the cassette is the workhorse of any integrated MBR membrane bioreactor system.
MLSS rises from roughly 3,000 mg/L in CAS to 6,000–12,000 mg/L in MBR, increasing biological treatment capacity in the same tank volume. Transmembrane pressure sits at 0.2 bar for flat-sheet modules and 0.3 bar for hollow-fiber, both well below the 0.5 bar chemical-cleaning trigger. Flat-sheet PVDF is the lower-maintenance choice for F&B with a roughly six-month cleaning interval versus weekly for hollow-fiber (HydropureWater field data, 2026). Permeate SDI runs 1–2.38, well below the RO feed limit of 3, so the same MBR effluent that discharges to sewer can feed downstream RO for reuse without tertiary clarification — a multi-media filter train that a CAS baseline would need.
MBR vs CAS on the Eight Parameters That Drive the Decision
The table below consolidates the eight parameters that drive the MBR vs CAS decision for a Kindred F&B plant. Values are drawn from Idris et al. 2021 (F&B pilot data), Mannina et al. 2020 (plant-wide modelling benchmark), and HydropureWater 2026 field data; the underlying DF series flat-sheet PVDF MBR cassette catalog data confirms the 60% biological-stage footprint claim.
| Parameter | CAS (typical) | MBR (typical) | Source |
|---|---|---|---|
| MLSS | 2,000–4,000 mg/L | 6,000–12,000 mg/L | Idris et al. 2021; HydropureWater 2026 |
| SRT | 5–15 d | 20–60 d | Banu et al. 2009; HydropureWater 2026 |
| COD rejection | 70–90% | 80–95% | Idris et al. 2021 |
| TSS rejection | 85–95% (clarifier-dependent) | >93% | Idris et al. 2021 |
| Effluent TSS | 10–30 mg/L (variable) | <2 mg/L | HydropureWater 2026 |
| Biological-stage footprint | Baseline (1×) | ~0.4× (60% smaller) | HydropureWater 2026 |
| Energy demand | Lower (process air only) | Higher (process + scour air) | Mannina et al. 2020 |
| Direct GHG (kgCO2eq/m³) | 0.85 | 0.91 | Mannina et al. 2020 |
| Sludge yield | Baseline | 20–40% lower at matched SRT | Banu et al. 2009 |
Two numbers deserve engineering attention before the table goes into a project memo. First, the 0.06 kgCO2eq/m³ direct-GHG gap is about 7% and can flip in MBR's favor once avoided sludge hauling and avoided tertiary filtration are credited (Mannina et al., 2020). Second, the 60% footprint figure refers to the biological stage only; site civil, EQ, and DAF footprint is unchanged, so total plant footprint savings on a greenfield are closer to 30–40% (HydropureWater 2026).
Mapping the Decision to Kindred and NDDEQ in 2026
The generic numbers above only become decision-grade once they are mapped to what NDDEQ Chapter 33.1-16-02 and the Cass Rural Water / City of Kindred utility pretreatment program actually enforce. The two tables below line up the compliance framework an F&B plant must clear in 2026 and score the major F&B sub-segments on which technology wins.
| Compliance parameter (Kindred 2026) | Limit | CAS margin | MBR margin |
|---|---|---|---|
| BOD (industrial discharge to sewer) | ~300 mg/L (per local sur-charge schedule) | Meets at steady load; tight on BOD shock days | Meets with wide safety margin |
| TSS (industrial discharge to sewer) | ~300 mg/L | Variable; clarifier-dependent | <2 mg/L, highly consistent |
| FOG / O&G | ~100 mg/L | Needs DAF pre-treatment | Needs DAF pre-treatment; tolerant of residuals |
| pH | 5.5–11 (typical) | Equalization required | Equalization required |
| Reuse readiness (RO feed SDI < 3) | RO feed | Needs tertiary filtration train | Permeate SDI 1–2.38, RO-ready |
| F&B sub-segment (Fargo-Cass corridor) | Influent character | CAS verdict | MBR verdict |
|---|---|---|---|
| Dairy (whey, CIP, FOG) | High FOG, BOD spikes | Viable with DAF, tight margin on shocks | Stronger: 6,000–12,000 mg/L MLSS buffer |
| Brewery / malting | Steady mid-strength, seasonal double | Viable, proven on steady streams | Stronger if seasonal doubling is material |
| Bottling / beverage | Low FOG, variable sugar, ~63% non-settleable COD | Viable on steady bottling lines | Stronger on high-color or sugar-spike days |
| Sugar beet processing | Very high COD, campaign-driven | Struggles on campaign peaks | Default: high-MLSS buffer absorbs shock |
Cold-climate note worth flagging to the project team: MBR cassettes are closed vessels, easier to insulate and enclose than open clarifiers, and they avoid the ice and algae problems that complicate CAS operation through a North Dakota winter. Mixed-liquor temperature holding at 8–12 °C slows CAS kinetics noticeably; MBR's decoupled HRT/SRT and higher MLSS buffer tolerates the same temperature band more reliably.
2026 Cost, Footprint, and Payback for a Kindred F&B Plant
Indicative 2026 turnkey CAPEX for skid-integrated, EPC-scope plants in the Kindred / Fargo-Cass corridor runs $80–$220 per m³/d for CAS and $180–$420 per m³/d for MBR. OPEX lands at $0.10–$0.22/m³ for CAS and $0.18–$0.42/m³ for MBR (HydropureWater 2026 engineering comparison). The gap is wide because CAPEX varies sharply with influent strength and with material selection, and because MBR energy is partly membrane scour air and partly process air.
Greenfield footprint savings of 30–40% translate to real dollars when industrial land in the Fargo-Cass corridor runs $15–$40 per square foot — less than coastal California but still material at full plant scale. The retrofit path is where most Kindred F&B plants will land in 2026: keep the existing aeration basin, drop a flat-sheet PVDF MBR cassette in place of the secondary clarifier, and add UV or RO downstream only if reuse credit is being pursued. For a deeper dive on how the cassette integrates, the MBR wastewater treatment system explained guide covers the mechanical and controls scope.
| Path | 2026 CAPEX ($/m³/d) | 2026 OPEX ($/m³) | Footprint vs CAS | Payback trigger |
|---|---|---|---|---|
| CAS greenfield | 80–220 | 0.10–0.22 | 1× (baseline) | Lowest CAPEX, ample land, no reuse |
| MBR greenfield | 180–420 | 0.18–0.42 | ~0.6–0.7× (30–40% smaller) | Reuse credit, tight TSS, land-constrained |
| CAS → MBR retrofit | 120–280 (incremental) | +0.08–0.20 vs CAS | Reuses existing aeration basin | 3–6 years when reuse, land cost, or <10 mg/L TSS consent applies |
The Four Questions to Answer Before You Pick a Technology
For a Kindred F&B plant in 2026, the decision reduces to four questions. Answer them honestly and the technology choice usually resolves itself.
- Influent stability: Is the stream steady on a CAS-compatible envelope, or does it carry FOG, sugar, or whey spikes that wash out a clarifier? Spikes push the answer toward MBR.
- Effluent target: Is the goal sewer discharge at BOD 300 mg/L / TSS 300 mg/L, or is reuse, Title 22-equivalent, or zero-liquid-discharge on the five-year roadmap? Reuse pushes the answer toward MBR.
- Land and envelope: Is the site constrained enough that the 30–40% greenfield footprint saving or the closed-vessel cold-weather advantages matter? Constraint pushes the answer toward MBR.
- Operating model: Is the plant staffed for membrane CIP every 1–4 weeks and cassette replacement on a 5–8 year cycle, or does simpler CAS operations fit the team better? Staffing reality can pull the answer back to CAS.
Frequently Asked Questions
Can MBR and CAS both meet typical NDDEQ industrial pretreatment limits for a Kindred F&B plant?
Yes. Both technologies can clear the BOD 300 mg/L / TSS 300 mg/L envelope that NDDEQ Chapter 33.1-16-02 and the Cass Rural Water / City of Kindred pretreatment program enforce. MBR has a wider safety margin, lower effluent TSS (under 2 mg/L versus 10–30 mg/L for CAS), and a permeate that is already RO-ready without tertiary filtration.
What MLSS does an MBR run at on food and beverage wastewater, and how does that compare with CAS?
An MBR on F&B influent typically runs at 6,000–12,000 mg/L MLSS, versus roughly 3,000 mg/L for CAS. The higher MLSS raises biological capacity in the same tank volume and gives MBR a buffer against BOD shocks that would wash floc out of a secondary clarifier (Idris et al., 2021).
Is the MBR footprint really 60% smaller than CAS on a food and beverage plant?
The 60% figure refers to the biological stage only — the cassette replaces a clarifier that would otherwise be 2–3× the cassette area. On a complete greenfield, including equalization, DAF, blowers, and civil work, the total site footprint saving is closer to 30–40% (HydropureWater 2026).
How long does it take to pay back an MBR upgrade over an existing CAS plant?
Typically 3–6 years when any of three conditions hold: (1) reuse water is needed and the CAS baseline requires a tertiary filtration train, (2) land acquisition cost makes the footprint saving material, or (3) the discharge consent requires TSS below 10 mg/L. If none of those apply, CAS remains the lower-cost compliant option.
Does MBR permeate need a tertiary filter before RO for reuse?
No. MBR permeate SDI runs 1–2.38, which is below the RO feed limit of 3, so the same MBR effluent that discharges to sewer can feed a downstream RO system for reuse without an intermediate multimedia or sand filter. This eliminates a CAPEX line that a CAS baseline would have to carry.