
What Domestic Sewage Sludge Actually Is
Domestic sewage sludge is the semi-solid byproduct of municipal wastewater treatment, produced when a publicly owned treatment works (POTW) separates liquids from the suspended and dissolved solids in domestic sewage. In the U.S., the term biosolids has a specific regulatory meaning: sewage sludge that has been treated to meet the pollutant ceilings, pathogen-reduction, and vector-attraction requirements in the EPA's 40 CFR Part 503 rule and is intended to be land-applied as a soil conditioner or fertilizer (per EPA, basic information about sewage sludge and biosolids, page updated 2024). The two terms are often used interchangeably in the press, but engineers should treat them as distinct: sludge is the raw or partially treated material leaving the clarifier or thickener; biosolids is the finished, compliant product.
Two sludge streams dominate any conventional activated sludge (CAS) plant. Primary sludge settles in the primary clarifier, where approximately 50% of the incoming suspended solids are removed within roughly 1.5 hours of hydraulic residence time. Secondary sludge — also called waste activated sludge (WAS) or biological excess sludge — is the surplus biomass wasted from the aeration basin to keep the mixed liquor suspended solids (MLSS) in the operating window. Tertiary or chemical sludge appears in plants with phosphorus or coagulation polish, but it is a minor fraction of the total solids mass at a domestic plant. Yield values, drawn from a consolidated municipal wastewater review (Wikipedia "Sewage sludge," referencing standard municipal engineering references, 2024), are:
- Primary sludge: 110–170 kg DS/ML (typical 150 kg DS/ML).
- Waste activated sludge: 70–100 kg DS/ML.
- Trickling filter biological sludge: 60–100 kg DS/ML.
The scale is large. About 16,000 U.S. WWTPs produce biosolids, and worldwide generation is estimated at up to 75 million Mg DS per year (S3).
How Much Sludge a Domestic Plant Generates in 2026
For a sizing engineer, the practical question is not "what is sludge" but "how many kilograms of dry solids per day will the downstream equipment have to handle." The consolidated yield table below links a design flow in megaliters per day (ML/d) to a sludge-handling duty in kg DS/d for the most common process configurations.
| Process configuration | Yield (kg DS/ML) | 10 ML/d plant (kg DS/d) | 30% DS cake equivalent (t wet/d) |
|---|---|---|---|
| Primary clarification only | 110–170 (typ. 150) | 1,500 | ~5.0 |
| CAS with primary (combined) | 180–270 | 1,800–2,700 | ~6.0–9.0 |
| WAS only (no primary) | 70–100 | 700–1,000 | ~2.3–3.3 |
| Trickling filter (biological only) | 60–100 | 600–1,000 | ~2.0–3.3 |
A worked example: a 10 ML/d municipal plant using primary clarification followed by CAS sits at the high end of the combined range and generates roughly 2,000–2,700 kg DS/d. After dewatering to a 30% DS cake, that translates to ~600–900 tonnes of wet cake per day for haul and disposal — the number that drives truck counts, bin rotations, and end-use gate fees. The yield moves with influent BOD/COD strength, solids retention time (SRT), and clarifier underflow consistency; membrane bioreactor (MBR) schemes with higher SRTs reduce excess sludge yield materially versus CAS, sometimes by 20–30%, because of higher endogenous decay (HydropureWater field data, 2026). Globally, the U.S. EPA estimated 7.7 million dry tons in 1997 and 6.8 million in 1998; the EU produced 10.1 million t DS/year across EU-27 per a 2012 review, and as of 2023 the EU range was 2–3 million tonnes per year (S3, citing the 2012 review and 2023 EU statistics).
The Standard Sludge Treatment Train
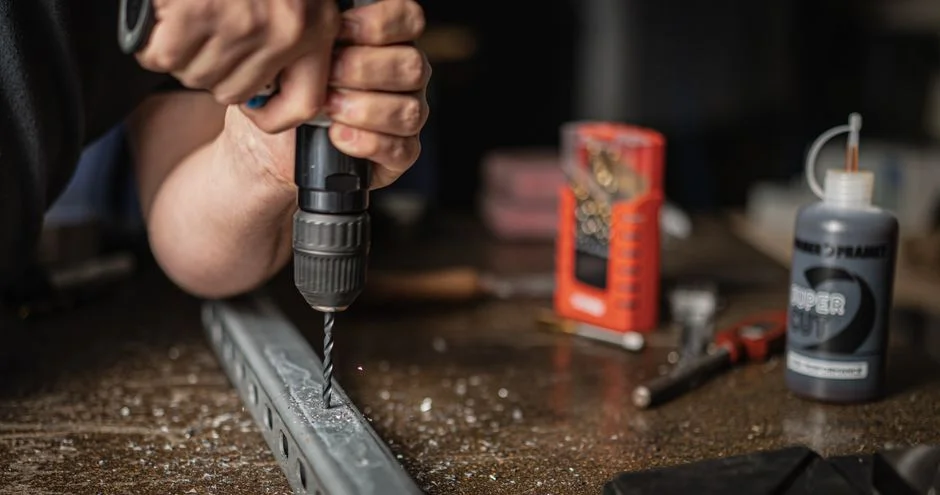
A canonical domestic sludge line runs thickening → stabilization → conditioning → dewatering, with optional drying or thermal conversion downstream. The objective at each step is mass and volume reduction: a 1% thickened sludge becomes a 30% cake, and the same mass now occupies roughly one-thirtieth of the volume — which is what cuts hauling cost, not the dewatering hardware alone.
| Unit operation | Function | Typical operating range | Mass/volume effect |
|---|---|---|---|
| Gravity thickening (primary) | Concentrate primary sludge | ~2–4% → 5–8% DS | Volume cut ~2× |
| DAF thickening (WAS) | Concentrate biological sludge via floated micro-bubbles | ~0.5–1% → 3–5% DS | Solids capture 85–95% |
| Mesophilic anaerobic digestion | Stabilize, reduce pathogens, generate biogas | 35–37°C, SRT 15–20 d | VS destruction 30–50%; biogas 60–70% CH4 |
| Polymer conditioning | Flocculate fine solids for dewatering | 4–12 kg polymer/t DS (typical) | Enables high-SR cake release |
| Ferric chloride + lime | Conditioning for incineration feed or class A | Dose varies with VS | Raises cake DS, fixes phosphorus |
| Plate-and-frame filter press | Batch dewatering under high pressure | Cake 20–35% DS | Volume cut ~4–6× from thickened feed |
| Decanter centrifuge | Continuous dewatering | Cake 20–28% DS | Higher power draw, smaller footprint |
Thickening is where the line either breathes or chokes. A lamella clarifier for primary sludge thickening and a DAF thickener for waste activated sludge are the two workhorses: gravity or lamella for primary sludge, DAF for WAS because of its higher solids capture on a fragile, low-density floc. Stabilization defaults to mesophilic anaerobic digestion (35–37°C, 15–20 day SRT) at any plant above ~5 ML/d, and the biogas it produces is either used in a combined-heat-and-power (CHP) unit or flared. Conditioning with synthetic polymer is standard; ferric chloride plus lime is reserved for feeds that will be incinerated or that must meet a stricter biosolids grade. Dewatering is where the volume economics close: a plate-and-frame filter press for sludge dewatering routinely reaches 28–35% DS cake — the level that makes incineration autothermal and that cuts haul mass materially versus a 22% centrifuge cake.
End-Use and Disposal Pathways in 2026
Three disposal pathways dominate the 2026 landscape, all of them recognized by the U.S. EPA: land application, landfilling (in a monofill or a co-disposal MSW cell), and incineration in a sewage sludge incinerator (SSI). As of 2023, about 40% of EU sludge output still went to agricultural land, with the balance split across incineration, landfilling, and other routes; a 2012 EU-15 review had reuse at 53% and incineration at 21% (S3, citing 2012 review and 2023 EU statistics). The U.S. picture is similar in direction but with more landfilling than the EU: a fraction of biosolids is land-applied under 40 CFR Part 503, a fraction is monofilled or co-disposed, and a fraction is incinerated, with the EPA collecting annual reports from roughly 2,350 facilities (per EPA, basic information about sewage sludge and biosolids, 2024).
Contaminant pressure is reshaping the choice. Cadmium in EU sewage sludge is now only about 1% of 1970 levels (S3), so the heavy-metal ceiling that defined sludge policy in the 1980s is no longer the binding constraint. What is rising is pathogen, microplastic, and PFAS scrutiny, and that is pushing more plants toward thermal destruction or advanced stabilization. Waste-to-energy has moved from pilot to procurement: dried biosolids carry a calorific value of about 12 MJ/kg, comparable to low-grade coal (S1), and plasma-assisted gasification configurations have been modeled at thermal efficiencies approaching 85% (S1). A small but growing number of 2026 retrofits are evaluating thermal drying plus waste-to-energy as the disposal endpoint instead of land application — a shift that materially changes the dewatering DS target downstream.
Choosing Stabilization and Dewatering Equipment
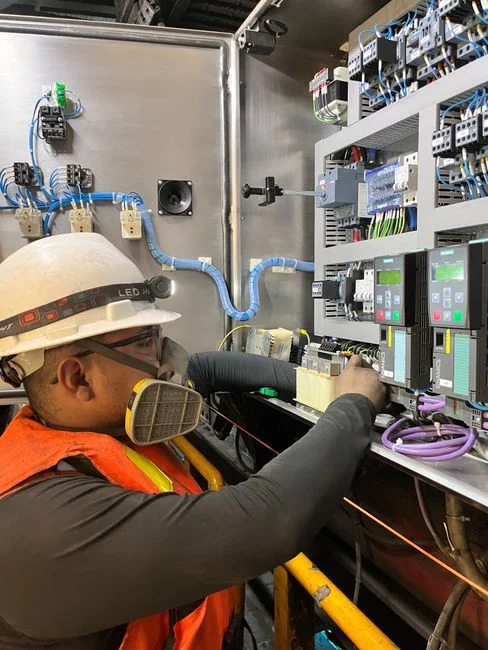
The selection framework below links the upstream sludge character and the downstream cake destination to specific equipment classes. It is built around two binary choices the engineer must make early: how the sludge will be stabilized, and where the cake will go.
| Decision driver | Preferred option | Operating target | Why |
|---|---|---|---|
| WAS thickening, limited footprint | DAF | 3–5% DS thickened | High solids capture on fragile floc; small civil footprint. |
| Primary thickening, low OPEX | Gravity / lamella | 5–8% DS thickened | Lowest energy; robust to grit and rags. |
| Combined stream thickening | Rotary drum thickener | 4–6% DS thickened | Handles blended sludge; polymer-augmented. |
| Cake for incineration or Class A biosolids (≥28% DS) | Plate-and-frame filter press | 28–35% DS cake | Highest cake solids; lower polymer dose variability. |
| Cake for land application (22–25% DS acceptable) | Decanter centrifuge | 20–28% DS cake | Continuous duty, smaller footprint, higher power draw. |
| Plant size, automation, operator skill | Filter press for 1–500 m² area | 1–500 m² plate area | Covers small municipal to large regional plants. |
Three variables decide real-world versus catalog DS performance more than the hardware choice itself: automation (pressure ramps, cycle time, cloth wash), polymer dose and mixing energy, and operator skill. A plate-and-frame filter press for sludge dewatering specified at 1–500 m² filtration area covers the full municipal duty range, and paired with the right polymer program it is the most forgiving dewatering option when the feed is variable. The companion reference for sizing dewatering trains in different jurisdictions is a sludge dewatering equipment selection guide; for adjacent industrial trains, a industrial wastewater sludge treatment process guide covers the heavier-metal side. For 2026 compliance framing in a specific jurisdiction, see a domestic sewage treatment compliance and process guide.
2026 Compliance Anchors and Operating Economics
In the U.S., 40 CFR Part 503 sets pollutant ceilings (trace metals), pathogen-reduction requirements (Class A or Class B), and vector-attraction reduction criteria for any biosolids that will be land-applied; the EPA collects annual biosolids reports from roughly 2,350 facilities (per EPA, basic information about sewage sludge and biosolids, 2024). In the EU, member-state rules are tightening around contaminants of emerging concern, and as of 2023 agricultural reuse sits at about 40% of sludge output (S3) with the share moving toward thermal or advanced treatment. The practical decision framework for a 2026 retrofit or new design is: if haul distance exceeds ~50 km or landfill tipping is high, push the dewatering target to ≥30% DS to cut hauled mass; if energy recovery is feasible on-site, evaluate thermal drying plus waste-to-energy because the biosolids calorific value of ~12 MJ/kg makes the energy balance work.
OPEX hierarchy in a typical municipal sludge line: dewatering performance is the single highest-leverage move, followed by polymer consumption, then haul distance, and finally the end-use gate fee. Lifting cake DS from 22% to 30% typically reduces wet tonnage hauled by ~25% and is the lever that pays for a filter-press upgrade in 18–36 months on most 5–20 ML/d plants (HydropureWater field data, 2026).
Frequently Asked Questions
How much dry sludge does a domestic wastewater plant produce per megaliter treated?
A conventional activated sludge plant with primary clarification produces 180–270 kg DS/ML treated; primary alone is 110–170 kg DS/ML, and waste activated sludge is 70–100 kg DS/ML (S3).
What is the difference between sewage sludge and biosolids?
Sewage sludge is the semi-solid byproduct of municipal wastewater treatment. Biosolids is sewage sludge that has been treated to meet the pollutant, pathogen, and vector requirements of 40 CFR Part 503 for land application (per EPA, basic information about sewage sludge and biosolids, 2024).
What DS target should a plate-and-frame filter press hit for incineration feed?
Target ≥28% DS cake, and typically 30–35% DS in steady operation, to make the downstream incinerator autothermal and to minimize hauled mass (HydropureWater field data, 2026).
What is the calorific value of dried biosolids?
About 12 MJ/kg, comparable to low-grade coal, which is why plasma-assisted gasification configurations have been modeled at thermal efficiencies approaching 85% (S1).