Why the Sewer Path, Not NPDES, Sets the Real Constraint
Mining and metals plants near Gerald, Missouri meet sewer pretreatment limits by operating under Clean Water Act §307(b) and 40 CFR Part 403, with categorical standards in 40 CFR Part 437 (Ore Mining and Dressing) and 40 CFR Part 433 (Metal Finishing) — but the binding numbers are the local POTW's sewer-use ordinance, which in 2026 typically sets zinc at 0.3–1.0 mg/L monthly average and copper at 0.3–0.5 mg/L monthly average, tighter than the federal floor. Categorical Industrial User status under Part 437 or 433 sets the compliance framework; the local ordinance sets the ceiling.
The sewer path controls because CWA §307(b) and 40 CFR Part 403 delegate sewer-discharge enforcement to the local POTW through its sewer-use ordinance — that ordinance is the controlling legal pathway for a Gerald-area plant discharging to a municipal manhole. NPDES permits, issued by EPA or the Missouri Department of Natural Resources under MDNR's Clean Water Commission delegation, govern stormwater and direct surface-water discharges, and most mining/metals operations carry both authorizations in parallel. Conflating the two pathways is the most common cause of treatment-train mis-sizing: NPDES surface-water limits are written around receiving-stream assimilation, while pretreatment limits are written around protection of the POTW's biological process, its sludge, and its workers. The chemistry is the same; the numerical targets and the consequence of a single excursion are not.
The federal categorical standards set the floor; the local POTW's sewer-use ordinance almost always sets a tighter ceiling — especially for zinc, copper, lead, and ammonia. The penalty structure is enforced: under CWA §309, civil penalties can reach $25,000 per day per violation, so a single excursion dwarfs the marginal cost of designing to the local ordinance from day one. In Missouri, MDNR runs the NPDES program, but the POTW pretreatment program is enforced by the receiving municipality — identify the receiving POTW and pull its current sewer-use ordinance before any equipment is specified.
Missouri-Specific Influent Profile and Pollutant Envelope
The southeast-Missouri lead-mining heritage fixes the design envelope: lead and zinc dominate the raw influent, and any plating, pickling, or anodizing line on site layers the 40 CFR Part 433 copper and chromium ceilings on top of the Part 437 floor. Design flow numbers should not come from generic US averages; they should come from this region's pollutant profile.
Raw acid mine drainage and spent process solutions in the region typically show pH 2–4, TSS in the hundreds to several thousand mg/L, dissolved Pb/Cu/Zn/Cd/Ni/As, and elevated sulfate and TDS in leach-pad runoff and brine streams. Downstream operations (plating, pickling, anodizing) add the 40 CFR Part 433 copper (3.38 mg/L daily max / 2.07 mg/L monthly average) and total chromium (2.77 mg/L daily max / 1.71 mg/L monthly average) ceilings on top of Part 437 categorical limits. Sampling must reflect batch discharges from shift changes, dump-leach cycles, and mill clean-outs; the equalization basin has to dampen those spikes, not pass them through.
Three 2024–2026 EPA trend drivers are reshaping what counts as compliant in Missouri. First, the Lead and Copper Rule Revisions (LCRR) are pushing lead action levels toward 10 µg/L, forcing many Missouri POTWs to re-derive local lead limits at much lower numbers in 2026. Second, EPA's 2024 Multi-Sector General Permit (finalized 2024-09) added PFAS monitoring requirements (PFOS, PFOA, PFHxS, PFNA) for metal-mining sectors, and many POTW control authorities are extending the same analytical suite to sewer discharges. Third, the 2025 ore-mining BAT revisions (2025-03) tightened the cost-benefit envelope on total recoverable metals, so future permit cycles will trend toward lower metals ceilings regardless of influent strength. Treat all three as the next-permit-cycle risk.
| Parameter | 40 CFR Part 437 Daily Max (mg/L) | 40 CFR Part 437 Monthly Avg (mg/L) | Typical Local POTW Limit (mg/L) |
|---|---|---|---|
| Zinc | 1.0 | 0.5 | 0.3–1.0 |
| Copper | 1.0 | 0.5 | 0.3–0.5 |
| Lead | 0.6 | 0.3 | 0.1–0.3 |
| Total Chromium | 1.0 | 0.5 | 0.5–1.0 |
| Cadmium | 0.5 | 0.3 | 0.1–0.3 |
| Nickel | 1.0 | 0.5 | 0.5–1.0 |
| pH (instantaneous) | 6.0–9.0 | 6.0–9.0 | 6.5–9.0 |
| TSS | 50 | 30 | 20–30 |
Equalization, pH Correction, and Reagent Selection

The equalization basin is the most undersized piece of equipment in most mining/metals pretreatment plants, and the most expensive to retrofit. Spec the basin at 8–24 hours of average daily flow to dampen batch discharges from shift changes, dump-leach cycles, and mill clean-outs; a 4-hour basin passes every shift-change slug straight to the clarifier and is the most common undersizing error in the field. pH correction comes immediately downstream, and the reagent choice is driven by TDS as much as by unit cost.
Target pH 6.5–9.0 to satisfy virtually every POTW's instantaneous range, and stage the dosing in two reactors if the influent swings more than 2 pH units. Lime (Ca(OH)₂) is cheaper per ton but generates 3–5× more sludge; high-TDS mining streams often justify the higher reagent cost of NaOH to keep sludge-handling capacity inside the existing footprint. In Missouri's high-TDS southeast-Missouri streams, NaOH is usually the better choice despite the reagent premium because it avoids the gypsum scaling and excess sludge that lime produces in sulfate-rich water. Automatic chemical dosing on a single PLC keeps pH inside a ±0.2 band, which is the difference between meeting and missing a 0.3 mg/L zinc monthly average; a HydropureWater automatic chemical dosing skid handling both pH adjustment and coagulant feed is the standard delivery format.
The downstream consequence of sloppy pH control is severe: each 1 pH unit away from the metals-precipitation optimum can cut removal efficiency by an order of magnitude, sending zinc from <1 mg/L to 10+ mg/L with no other change to the chemistry. Size each pH reactor at 20–30 minutes HRT per stage so the acid-base reaction completes before floc formation begins.
Metals Precipitation: Hydroxide vs Sulfide, and How to Lock the pH Window
Hydroxide precipitation with NaOH or lime is the default for most plants because the reagent is cheap and the chemistry is well understood. Sulfide precipitation (NaHS, FeS, Na₂S) is reserved for streams where residual metal must drop below 0.1 mg/L; sulfide residuals are typically 0.01–0.05 mg/L for Cu/Zn/Cd/Ni versus 0.5–2.0 mg/L for hydroxide, an order of magnitude cleaner. The trade is real: reagent cost runs 2–4× higher and operators must control H₂S off-gassing with sealed reactors and scrubbed vents. For most Missouri mining flows, hydroxide precipitation with sulfide polishing on a slipstream is the cost-effective compromise that hits local zinc and lead ceilings without the full sulfide system overhead.
The optimum pH window is parameter-specific and must be locked in with jar testing, not vendor literature. The table below gives the working range for the metals this region actually carries. Properly controlled precipitation systems in operating mining/metals installations routinely achieve 85–95% total metals removal (Fluence, 2024-11). A polymer coagulant aid dosed at 0.5–3 mg/L floccs the metal hydroxide particles fast enough for the clarifier to operate at 20–40 m/h hydraulic loading without carryover and reduces TDS bleed by collapsing the colloidal fraction before settling.
| Metal | Hydroxide Precipitate | Optimum pH (Hydroxide) | Typical Hydroxide Residual (mg/L) | Typical Sulfide Residual (mg/L) |
|---|---|---|---|---|
| Zinc (Zn²⁺) | Zn(OH)₂ | 9.0–10.0 | 0.5–1.0 | 0.01–0.05 |
| Copper (Cu²⁺) | Cu(OH)₂ | 9.0–10.0 | 0.5–1.0 | 0.01–0.05 |
| Lead (Pb²⁺) | Pb(OH)₂ | 9.0–10.0 | 0.5–2.0 | 0.02–0.05 |
| Cadmium (Cd²⁺) | Cd(OH)₂ | 10.0–11.0 | 0.5–2.0 | 0.01–0.05 |
| Nickel (Ni²⁺) | Ni(OH)₂ | 10.0–11.0 | 0.5–2.0 | 0.05–0.1 |
| Chromium III (Cr³⁺) | Cr(OH)₃ | 8.0–9.0 | 0.5–1.0 | — |
DAF vs Lamella Clarifier: The Decision That Actually Moves the CapEx Number
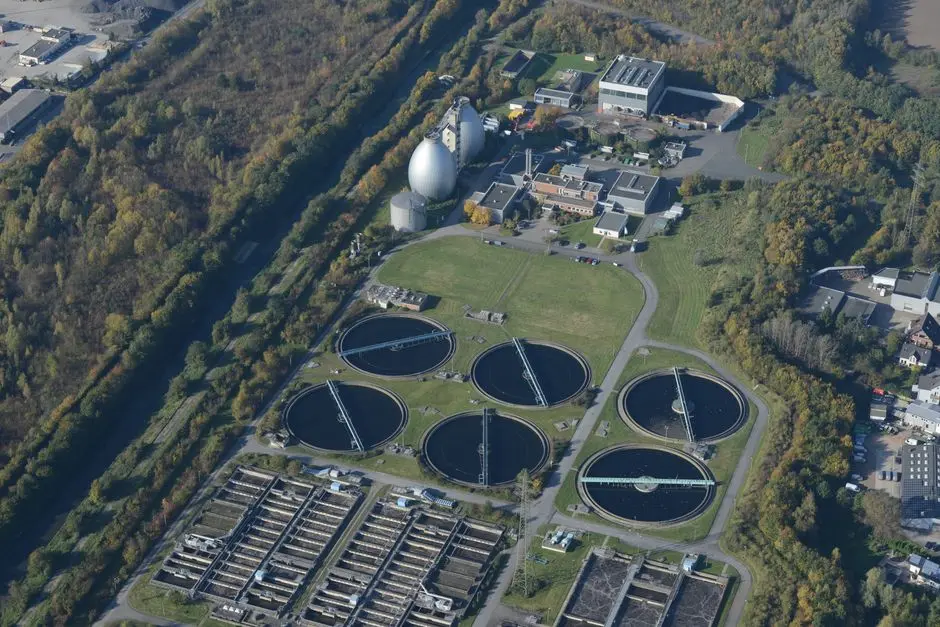
This is the decision most engineers actually face in a real project: DAF or lamella. Both work; neither is universally better. The right pick is driven by stream character and flow band, not vendor preference.
The HydropureWater dissolved air flotation system covers 4–300 m³/h across 13 standard models, operates at 5–25 m/h hydraulic loading, and achieves 90–98% TSS and 85–95% oil/grease removal in mining/metal-finishing service. It floats oil-coated and colloidal particles with microbubbles, which is the mechanism that gives it the edge on free oil and fine colloidal metals. The HydropureWater high-efficiency sedimentation tank (lamella clarifier) operates at 20–40 m/h surface loading in roughly one-third the footprint of a conventional clarifier, has lower chemical consumption because the sludge blanket is denser, and handles heavy metal-hydroxide flocs very well. It does not remove free oil or colloidal fines as effectively as DAF.
Use the heuristic: pick DAF when the stream carries oil, grease, or fine colloidal metals; pick lamella when the stream is primarily a metal-hydroxide sludge at high flow and the footprint is constrained. Below 10 m³/h, packaged DAF skids are common; above 100 m³/h, multiple DAF trains in parallel or a lamella clarifier typically becomes more economical. For a deeper side-by-side of the two technologies, see the DAF vs clarifier decision guide for fabricated metals.
| Parameter | DAF | Lamella Clarifier |
|---|---|---|
| Flow range (m³/h) | 4–300 (13 models) | 20–500+ |
| Hydraulic / surface loading | 5–25 m/h | 20–40 m/h |
| TSS removal | 90–98% | 80–95% |
| Oil & grease removal | 85–95% | 30–60% |
| Footprint | Compact (packaged skid) | ~1/3 of conventional clarifier |
| Best-fit stream | Oil, colloidal fines, flow <200 m³/h | Metal-bearing sludge, flow >100 m³/h |
| Chemical consumption | Baseline | Up to 30% lower in metal-hydroxide service |
Multimedia Filtration, Disinfection, and Sludge Dewatering
A multimedia filter (anthracite over sand over garnet) is the safety net between the clarifier and the sewer manhole. At 1–2 m/h filtration rate with backwash triggered on differential pressure, it strips residual TSS to <10 mg/L and provides a buffer for the days the clarifier underperforms because of a polymer mis-dose or a hydraulic surge. Size the HydropureWater multi-media filter for the backwash cycle, not the average flow.
UV or chlorine dioxide disinfection appears in the local sewer-use ordinance whenever the POTW's collection system has long force mains, siphons, or pathogen-prone co-tenants. A HydropureWater chlorine dioxide generator dosed at 1–5 mg/L provides the residual the POTW asks for without forming the regulated trihalomethanes that chlorine produces. Sludge from the clarifier and DAF is itself a regulated waste: a HydropureWater plate and frame filter press dewateres the sludge to 25–35% dry solids, producing a stackable cake that can be hauled to a Subtitle-D landfill or sent to a smelter for recoverable metals. Filtrate returns to the head of the plant and must be accounted for in the hydraulic design — a 25% dry-solids cake still carries 3 kg of water per kg of solids. Design the filter and press for peak 2-hour flow with 20–30% turndown, not for the average day.
2026 Design Sizing Worksheet and Cost Ballpark for a Gerald-Area Plant
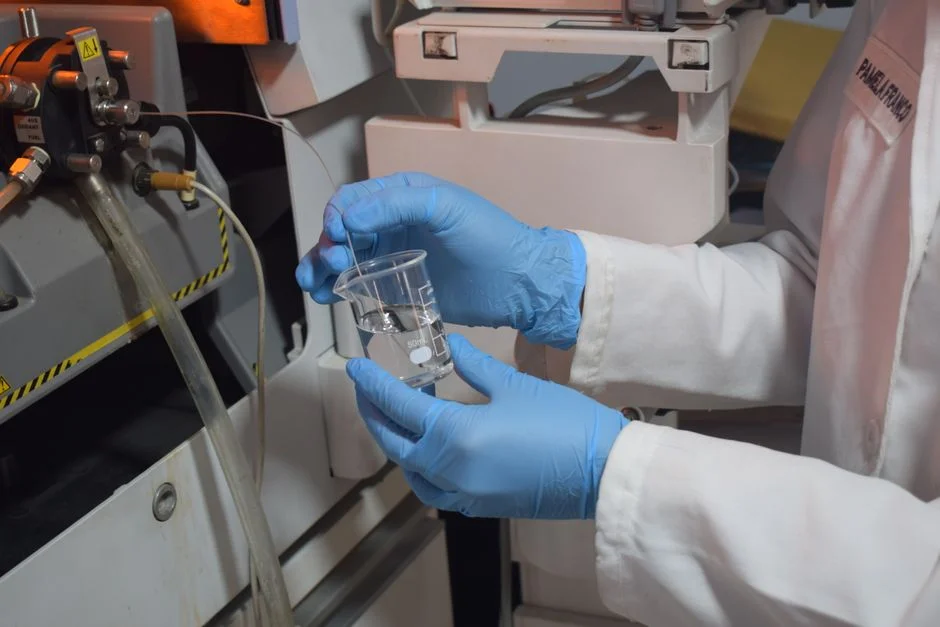
Use the following deterministic flow as the agenda for the first vendor meeting. Any vendor who cannot speak to each step in these terms is not qualified for a 2026 Missouri mining project.
Step 1 — Anchor the design flow. Start from peak 2-hour flow, then size the equalization basin at 8–24 hours of average daily flow depending on dump-leach and shift-change variability. Step 2 — Set pH reactor count. One reactor if influent swings <2 pH units, two staged reactors if it swings more; size each stage at 20–30 minutes HRT. Step 3 — Pick the clarifier. DAF for 4–100 m³/h streams with oil or colloid load, lamella for >100 m³/h metal-hydroxide streams; size DAF at 5–25 m/h hydraulic loading and lamella at 20–40 m/h surface loading. Step 4 — Size the polishing and sludge train. Multimedia filter at 1–2 m/h for peak flow, and the plate and frame press for the total dry-solids load from clarifier plus DAF. Step 5 — Treat to the local POTW ordinance, not the federal categorical floor, because the local numbers are tighter and the penalty structure is enforced.
| Capacity Tier (m³/h) | Typical Train Configuration | CAPEX Band (USD) |
|---|---|---|
| Up to 50 | Packaged DAF + hydroxide precipitation + multimedia filter + sludge press | Low six figures |
| 50–200 | Lamella clarifier + hydroxide precipitation with sulfide polishing on slipstream + multimedia filter + press | Mid six figures |
| 200–500+ | Full sulfide precipitation + on-site sludge stabilization + dedicated press line | High six figures to seven figures |
Exact CAPEX depends on influent variability, local ordinance stringency, and tankage scope; the bands above are first-pass engineering estimates for a turnkey Missouri installation. For a parallel compliance blueprint covering adjacent sectors, see the MBR vs conventional activated sludge for mining wastewater guide, and the mining/metals pretreatment guide for Skiatook, OK for a comparable Oklahoma regulatory context. For a global numerical reference, see the 2026 global heavy-metal discharge limits reference.
Frequently Asked Questions
Does an NPDES permit cover sewer discharge from a Missouri mining or metals plant?
No. NPDES permits govern direct discharge to surface water under Clean Water Act §402 and are issued in Missouri by MDNR under the Clean Water Commission delegation. Sewer discharge to a POTW is regulated under CWA §307(b) and 40 CFR Part 403, with categorical standards in 40 CFR Part 437 (Ore Mining and Dressing) and 40 CFR Part 433 (Metal Finishing) where applicable. Most plants carry both authorizations because they have separate stormwater outfalls; conflating the two is the most common cause of treatment-train mis-sizing.
How much tighter are local POTW limits than the federal categorical standard in 2026?
Local sewer-use ordinances in 2026 typically set zinc at 0.3–1.0 mg/L monthly average and copper at 0.3–0.5 mg/L monthly average, which is tighter than the 40 CFR Part 437 categorical standard of 1.0 mg/L daily max / 0.5 mg/L monthly average for zinc. With the 2025 ore-mining BAT revisions and LCRR-driven lead re-derivations, the gap between local and federal numbers is widening, not closing. Always confirm against the specific receiving POTW's sewer-use ordinance before specifying equipment.
When does sulfide precipitation beat hydroxide precipitation for a Missouri flow?
Sulfide precipitation (NaHS, FeS, Na₂S) achieves residual metals of 0.01–0.05 mg/L versus 0.5–2.0 mg/L for hydroxide, which matters when the local limit is below 0.3 mg/L or when LCRR pushes the lead ceiling toward 10 µg/L. The trade: reagent cost runs 2–4× higher and the system requires sealed reactors with H₂S scrubbing. For most Missouri mining flows, hydroxide precipitation with sulfide polishing on a slipstream is the cost-effective compromise that hits the local zinc and lead ceilings without the full sulfide system overhead.
What flow range does a standard DAF system cover for a 2026 mining/metals project?
Standard DAF units cover 4–300 m³/h across the typical product range (13 models), with hydraulic loading of 5–25 m/h and 90–98% TSS removal. Below 10 m³/h, packaged skid systems are common; above 100 m³/h, multiple DAF trains in parallel or a lamella clarifier at 20–40 m/h surface loading typically becomes more economical. For flows above 200 m³/h with primarily metal-hydroxide sludge and a constrained footprint, a lamella clarifier is the standard delivery format.
What is the real cost of a single pretreatment excursion under CWA §309?
Civil penalties under CWA §309 can reach $25,000 per day per violation, and a single zinc or lead monthly-average exceedance can trigger a Significant Noncompliance (SNCR) flag that follows the facility through the next permit cycle. That single excursion typically dwarfs the marginal cost of designing to the local ordinance from day one — treat the local POTW sewer-use ordinance as the binding number, not the federal floor.