What an Effluent Treatment Plant Must Do in Toronto
An effluent treatment plant (ETP) in Toronto is engineered to bring industrial wastewater to Ontario Regulation 224/07 effluent limits — typically BOD ≤300 mg/L, TSS ≤350 mg/L, and total phosphorus ≤10 mg/L for discharges to Toronto sanitary sewers — before the treated stream is metered, surcharged, and released. A 2026-grade ETP pairs primary clarification with either MBR (submerged PVDF, <1 µm) or DAF + biological treatment, and often adds UF/RO polishing for water-reuse duty, which can cut Toronto Water surcharges by 40–60%.
The scope is fixed by the receiving environment. For plants discharging to the Toronto sanitary sewer, Reg. 224/07 sets the hard ceiling on BOD, TSS, total phosphorus (≤10 mg/L), pH (6.0–9.5), and oil & grease (≤100 mg/L) where the trade-waste by-law applies (per Ontario Reg. 224/07, 2026). For sites discharging directly to Lake Ontario, the MECP EASR pathway and the federal Wastewater Systems Effluent Regulations (WSER) tighten the envelope further, particularly for total residual chlorine, ammonia, and BOD₅. The standard train — headworks, primary clarification, biological treatment, tertiary polishing, disinfection, and metered sampling — applies in both cases, but the unit-process selection shifts when the destination changes.
The cost driver is the Toronto Water Industrial Surcharge. Any volume and load above the domestic-strength baseline is metered and billed, so lower-strength effluent directly lowers OPEX (per Toronto Water Wastewater Surcharge Schedule, 2026). The by-law also requires continuous flow metering and auto-sampling for industrial users above defined thresholds; planning the sampling station during design avoids retrofit costs. The Lake Ontario watershed context pushes Toronto ETPs toward tighter P limits and emerging micropollutant controls than comparable inland plants, which is why reuse-grade polishing is increasingly part of the base scope rather than a future option.
Influent Characterization for Toronto Industrial Sites
Toronto's industrial base is dominated by four stream archetypes, and the unit-process train follows from which one your plant resembles. Food & beverage streams run high in BOD/COD and FOG; metal finishing adds heavy metals (Cu, Ni, Zn), low pH, and cyanide; pharma and personal care contribute high COD, solvents, and variable pH; landfill leachate brings ammonia-N and refractory organics that resist conventional biology. Each profile forces a different equalization volume, different pre-treatment chemistry, and a different biology configuration.
Typical 2026 ranges for Toronto-area streams: food processing BOD 800–5,000 mg/L and FOG 200–2,000 mg/L; metal finishing TSS 100–800 mg/L with Cu/Ni/Zn 1–50 mg/L each; landfill leachate NH₃-N 200–2,000 mg/L and COD 5,000–20,000 mg/L; pharma/cosmetics COD 1,000–8,000 mg/L with intermittent solvent slugs. A 24-hour composite sample across at least one production week — including batch discharges — is the minimum defensible characterization for budget-grade design (HydropureWater field data, 2026).
The volume question matters as much as the concentration question. Modern kraft pulp mills discharge roughly 60 m³ of effluent per air-dried tonne (ADT), down from 200 m³/ADT in the 1960s (BioResources, 2022). A high-volume Toronto food or paper plant at 2,000 m³/day with a 2,000 mg/L BOD load generates the same oxygen demand as a 200 m³/day specialty chemical plant at 20,000 mg/L — but the equalization and biology sizing are different problems. Map your flow and load first; the unit-process selection and the sludge-handling budget both fall out of it.
| Stream | BOD (mg/L) | COD (mg/L) | TSS (mg/L) | FOG / NH₃-N | Design driver |
|---|---|---|---|---|---|
| Food & beverage | 800–5,000 | 1,500–10,000 | 200–1,500 | FOG 200–2,000 mg/L | Equalization + FOG removal |
| Metal finishing | 50–300 | 100–800 | 100–800 | Cu/Ni/Zn 1–50 mg/L | pH correction + metals precipitation |
| Pharma / cosmetics | 500–3,000 | 1,000–8,000 | 100–500 | Solvents variable | Equalization + solvent stripping |
| Landfill leachate | 1,000–5,000 | 5,000–20,000 | 200–1,000 | NH₃-N 200–2,000 mg/L | High-rate nitrification + RO polish |
Unit Process Train: Primary, Secondary, Tertiary
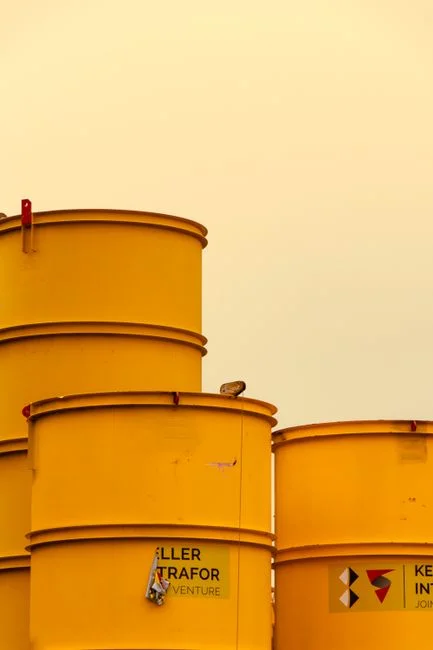
The headworks starts with a rotary mechanical bar screen with 3–6 mm openings to protect downstream pumps, followed by grit removal and a primary clarifier sized for 1.5–2.5 h hydraulic retention. Dual-bypass overload protection is standard on Toronto industrial headworks because batch food and pharma discharges routinely deliver peak flows 3–5× the daily average (HydropureWater field data, 2026). Equalization tanks sized for 6–24 h HRT dampen the diurnal swings before biology; under-sizing EQ is the single most common cause of permit excursions on retrofit projects.
Secondary treatment is where the major process choice lives. Conventional activated sludge (CAS) is a mature, low-CAPEX option that works at any scale. Sequencing batch reactors (SBR) add operational flexibility in a smaller footprint. A submerged MBR system with PVDF membranes at 0.1–0.4 µm pore size produces near-reuse effluent, runs at mixed-liquor suspended solids (MLSS) of 8,000–12,000 mg/L, and shrinks the biological tank volume by roughly 60% compared to CAS. MBR also eliminates the secondary clarifier, which removes a common failure mode in cold-weather Toronto operation.
Tertiary polishing typically pairs a lamella clarifier or DAF pre-treatment for FOG and TSS with a multimedia filter ahead of any membrane step. DAF units in the 4–300 m³/h range are the standard workhorse for FOG-laden food streams, removing 60–90% of FOG and TSS in a single stage. Disinfection is the last wet step: a ClO₂ disinfection generator rated up to 20,000 g/h handles regulated Toronto effluent where a residual is required, while UV is the chemical-free option that effectively inactivates chlorine-resistant Cryptosporidium and Giardia (per EPA UV Disinfection Guidance Manual, 2024). For water-reuse duty, UF (0.01–0.05 µm) and RO follow disinfection.
Sludge handling is the second-largest OPEX line and must be designed in parallel with biology, not after. A plate and frame filter press for sludge dewatering with 1–500 m² filtration area cuts sludge volume for off-site disposal and pays back typically in 12–24 months on Toronto disposal rates. Aeration is 50–60% of plant electricity; combine it with sludge handling and you have accounted for roughly 80% of OPEX before counting chemicals or labor (HydropureWater field data, 2026).
| Stage | Equipment | Key parameter | Toronto design value |
|---|---|---|---|
| Headworks | Rotary bar screen + grit | Bar spacing | 3–6 mm |
| Equalization | EQ tank with aeration | HRT | 6–24 h |
| Secondary | CAS / SBR / MBR | MLSS | 2,500–4,000 (CAS) / 8,000–12,000 (MBR) mg/L |
| Tertiary | DAF or lamella + MMF | FOG/TSS removal | 60–90% FOG, >85% TSS |
| Disinfection | ClO₂ or UV | Dose / fluence | 2–5 mg/L ClO₂ or 40 mJ/cm² UV |
| Sludge | Plate & frame press | Cake dryness | 22–28% DS |
MBR vs Conventional Activated Sludge vs DAF + MBR: Head-to-Head
Process selection collapses to three questions: what is the FOG/TSS load, is reuse water a project goal, and is footprint the binding constraint. The table below compares the three realistic trains for a Toronto industrial ETP on the criteria a procurement manager actually needs.
| Criterion | CAS | MBR | DAF + MBR |
|---|---|---|---|
| Footprint (relative) | 1.0× (baseline) | ~0.4× | ~0.5× |
| Effluent BOD (mg/L) | ≤20 | ≤5 | ≤5 |
| Effluent TSS (mg/L) | ≤20 | ≤1 (sub-µm filtered) | ≤1 |
| Energy (kWh/m³) | 0.3–0.6 | 0.6–1.2 | 0.7–1.3 |
| MLSS (mg/L) | 2,500–4,000 | 8,000–12,000 | 8,000–12,000 |
| Operator skill | Standard | Standard + membrane care | Standard + membrane + DAF |
| Retrofit ease | High | Moderate (membrane cassette fit) | Moderate |
| CAPEX class | Lowest at >5,000 m³/d | +15–25% vs CAS | +20–30% vs CAS |
| Best fit | High flow, sewer-only discharge, ample land | Reuse goal or tight footprint | High FOG / TSS or metal-finishing stream |
MBR wins on footprint (60% smaller than CAS) and on effluent quality (<1 µm filtered, near-reuse quality), and the higher MLSS enables compact tanks. CAS wins on CAPEX for very large flows — typically above 5,000 m³/day — where footprint is not binding and reuse is not a project goal. DAF pre-treatment ahead of an MBR system is the right answer for Toronto food & beverage and metal finishing where FOG, oil, or heavy metals must be removed before biology, because DAF pre-removes 60–90% of FOG and TSS and protects the membranes from fouling. Process intensification in the GTA is an active engineering practice (ResearchGate, 2024), and most retrofits in the region are MBR or DAF+MBR insertions into existing CAS tanks.
Decision rule: if the site needs reuse water or has a tight footprint, choose MBR. If the stream is high-FOG or high-TSS, put DAF ahead of MBR. If the only goal is sewer compliance at >5,000 m³/day and CAPEX is the constraint, CAS still earns its place.
CAPEX and OPEX Benchmarks for a Toronto ETP
Toronto ETP CAPEX in 2026 ranges from roughly CAD 0.5–2 million for a packaged 100 m³/day biological plant to CAD 10–25 million for a 1,000+ m³/day custom build; MBR adds 15–25% over CAS for the same flow, and DAF+MBR adds another 5–10% (HydropureWater field data, 2026). Site civil work, building enclosure, and the sampling/metering station typically add 20–35% to the equipment CAPEX — budget them explicitly or the project runs over.
OPEX is dominated by energy and sludge. Aeration alone is 50–60% of plant electricity; adding sludge management, the two together account for roughly 80% of OPEX, and sludge handling alone is about 60% of total ETP OPEX in waste-activated-sludge systems (BioResources, 2022). A plate and frame filter press cuts sludge volume for off-site disposal and typically pays back in 12–24 months on Toronto tipping fees.
Toronto Water Industrial Surcharge is the real ROI lever. Every cubic metre of treated effluent avoided through on-site reuse saves roughly CAD 1.50–4.00/m³ in 2026 rates (per Toronto Water Wastewater Surcharge Schedule, 2026). For a 500 m³/day plant reusing 40% of its effluent, that is CAD 110,000–580,000 per year — often enough to fund the UF/RO polishing train inside the project's payback horizon. For a deeper line-item breakdown, see the organic wastewater CAPEX/OPEX breakdown.
| Flow (m³/day) | CAPEX range (CAD) | OPEX (CAD/m³) | Sludge OPEX share | Reuse-driven savings potential |
|---|---|---|---|---|
| 100 | 0.5–2 M | 1.5–3.0 | ~60% | CAD 55K–145K/yr at 40% reuse |
| 500 | 3–8 M | 1.0–2.0 | ~60% | CAD 110K–290K/yr at 20% reuse |
| 1,000+ | 10–25 M | 0.7–1.5 | ~60% | CAD 220K–580K/yr at 20% reuse |
Compliance Checklist and Selection Framework
Five ordered steps move a Toronto ETP from influent sample to a defensible vendor short-list.
- Characterize the influent. Run 24-h composite sampling across at least one production week, including batch discharges and any cleaning-in-place cycles. You cannot size biology or equalization without a flow-weighed load.
- Confirm the discharge route. Toronto sanitary sewer (Ontario Reg. 224/07) versus direct discharge to Lake Ontario (MECP EASR/EAA, federal WSER) sets different numeric limits and a different permit pathway; see the Toronto wastewater discharge permit guide for the application sequence.
- Pick the process train. Use the head-to-head table: reuse or tight footprint → MBR; high FOG/TSS → DAF+MBR; very high flow with sewer-only discharge → CAS.
- Size sludge and disinfection with biology. Aeration is 50–60% of electricity; sludge is ~60% of OPEX. Designing the filter press and the disinfection system in parallel with the biological tanks prevents the common retrofit where the OPEX model breaks 18 months after startup.
- Plan metering, sampling, and the operating log. Continuous flow metering, auto-sampling, and a 12-month operating log satisfy Toronto Water audit expectations and shorten the next permit cycle. The MBR market outlook for 2026 is worth reading before committing CAPEX, since membrane pricing and module life are still moving year-on-year.
Frequently Asked Questions
What are the Ontario Reg. 224/07 effluent limits for an industrial ETP discharging to a Toronto sanitary sewer?
For discharges to Toronto sanitary sewers, Ontario Reg. 224/07 sets BOD ≤300 mg/L, TSS ≤350 mg/L, total phosphorus ≤10 mg/L, pH 6.0–9.5, and oil & grease ≤100 mg/L where applicable (per Ontario Reg. 224/07, 2026). Direct discharges to Lake Ontario are governed by MECP EASR/EAA and the federal Wastewater Systems Effluent Regulations, which tighten BOD, ammonia, and total residual chlorine limits.
How does the Toronto Water Industrial Surcharge change the economics of an ETP?
Any volume and load above the domestic-strength baseline is metered and billed, so lower-strength effluent directly reduces OPEX. In 2026 rates, every cubic metre of treated effluent avoided through on-site reuse saves roughly CAD 1.50–4.00/m³ (per Toronto Water Wastewater Surcharge Schedule, 2026). At 40% reuse on a 500 m³/day plant, that is CAD 110,000–290,000 per year — often enough to fund the UF/RO polishing train inside the project's payback horizon.
Why is MBR preferred over conventional activated sludge for Toronto industrial sites?
An MBR with PVDF membranes at 0.1–0.4 µm pore size produces <1 µm filtered effluent suitable for reuse, runs at 8,000–12,000 mg/L MLSS, and shrinks the biological tank volume by roughly 60% compared to CAS. MBR also eliminates the secondary clarifier, which is a common failure mode in cold-weather Toronto operation. The trade-off is 15–25% higher CAPEX and 0.6–1.2 kWh/m³ energy versus 0.3–0.6 kWh/m³ for CAS (HydropureWater field data, 2026).
Why does sludge handling dominate ETP OPEX in Toronto?
Sludge management and disposal account for roughly 60% of total ETP OPEX in waste-activated-sludge systems, and combined with aeration (50–60% of plant electricity) the two items make up about 80% of operating cost (BioResources, 2022). A plate and frame filter press sized to the biological yield cuts sludge volume for off-site disposal and typically pays back in 12–24 months on Toronto tipping fees, which is why sludge handling should be designed in parallel with biology from day one.