What drives organic wastewater treatment cost today?
Organic wastewater treatment cost typically runs $0.80–$4.50 per m³ treated, set by technology, influent COD/BOD, and regional sludge fees. For a 500 m³/day food plant, MBR CAPEX averages about $3.2M versus roughly $2.1M for CAS, with sludge near $0.25/m³ versus $0.50/m³ and a common 3–5 year payback.
Membrane replacement, aeration energy, and reuse or pretreatment rules such as China’s GB 31573-2015 and US EPA 40 CFR Part 403 still dominate long-term cash flow. Plant engineers should treat installed capital as the entry ticket only. Lifetime operating cost usually decides which process wins on organic-heavy wastewater.
Why treatment costs keep climbing
Sludge disposal fees have risen about 40% since 2020 and now make up 25–35% of total OPEX on many conventional activated sludge (CAS) trains. That solids line alone forces organic-heavy plants to reassess dewatering before they buy more aeration volume. Tertiary polishing for reuse commonly adds another $0.30–$0.80/m³ of OPEX when permits move beyond secondary discharge.
Chemical costs for coagulants and polymers have kept climbing even where power prices stabilized, with some sites seeing roughly 15% year-over-year chemical inflation. A 200 m³/day dairy plant in California watched total OPEX jump from $1.20/m³ to $2.10/m³ after Title 22 reuse limits took effect. Most plants we size for food or beverage waste still underestimate haul fees until the first full operating year closes.
Pressure from EU Urban Waste Water Directive 91/271/EEC toward higher effluent quality reinforces the same pattern across export-facing factories. Secondary biology is no longer the full cost story. Facilities that ignore solids handling and reuse add-ons under-budget OPEX by a wide margin and then face surcharge shocks from the receiving sewer authority.
When leadership asks why the unit cost moved, separate power, polymer, and tip-fee inflation from true process inefficiency. A blower that runs fixed speed at night and a filter press that leaves wet cake create different fixes. Mixing those root causes into one “treatment is expensive” narrative blocks the right CAPEX request.
What is a water treatment plant cost breakdown?
A water treatment plant cost breakdown splits spend into CAPEX—civil works, process equipment, membranes, and installation—and OPEX—energy, sludge, chemicals, labor, and maintenance—expressed both as $/m³/day of capacity and as $/m³ treated. For organic industrial wastewater, technology choice moves both sides of that ledger at once, so a low civil bid can still lose on five-year cash flow.
Teams comparing regions can also review a sibling India-focused capex and opex package when local labour and land prices differ sharply from US or EU baselines. Use capacity-normalized CAPEX for vendor quotes, then convert OPEX with your real power tariff, polymer price, and landfill tip fee. Without both views, procurement locks the wrong process block.
Procurement check before award: confirm design flow and peak factor, freeze COD/BOD basis of design, and state whether the effluent target is sewer discharge or reuse. Those three inputs change unit rates more than brand preference. Add a contingency line for membrane modules or major rotating equipment so the first change order does not erase the apparent CAPEX saving.
Keep a simple ownership scorecard beside every vendor quote: installed CAPEX, expected kWh/m³, wet-tonnes of sludge per month, polymer kg/m³, and staffing hours per day. Those five numbers explain more variance in organic wastewater unit cost than brochure removal percentages. If a bidder cannot populate the scorecard from reference plants, treat the quote as incomplete.
CAPEX ranges by process and capacity
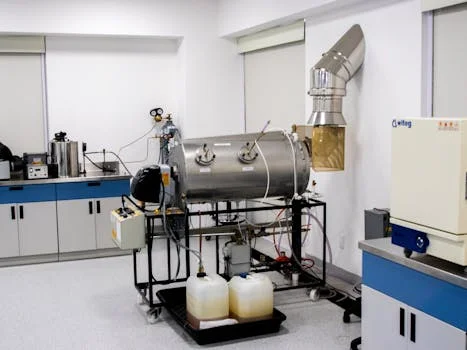
Capital expenditure for an organic wastewater treatment system varies widely by process family and rated capacity. Conventional activated sludge (CAS) typically sits at $1,200–$3,500 per m³/day of capacity. On a mid-sized 500 m³/day plant that points to roughly $600,000 at the low end of the CAS band when civil scope stays simple.
Membrane bioreactor packages usually run $2,500–$6,000/m³/day, or about $1.5 million for 500 m³/day including membranes, when reuse-quality effluent and a compact footprint matter. Sequencing batch reactors land between $1,800–$4,200/m³/day, near $900,000 for the same 500 m³/day example. Anaerobic digestion for high-strength food or chemical streams often needs $3,000–$8,000/m³/day, around $2 million at 500 m³/day, before biogas credits improve payback.
Earlier headline examples in this topic also cite about $3.2M MBR versus $2.1M CAS for a 500 m³/day food plant when membranes, install, and tighter civil scope are fully loaded. Those project-level totals sit above the bare $/m³/day equipment bands and should be used when comparing turnkey bids, not skid-only quotes. Ask each bidder to show where membranes, instrumentation, and startup chemicals sit in the price.
Land and build method shift the total as much as the process block. MBR trains need 50–70% less footprint than CAS, which can save $100–$500/m² where industrial land is tight. Prefabricated underground MBR packages such as pre-fabricated underground MBR systems for organic wastewater can cut CAPEX 20–30% versus site-built civil works and shorten installation schedules on constrained plots.
| Technology | CAPEX Range ($/m³/day capacity) | Example CAPEX (500 m³/day plant) |
|---|---|---|
| Conventional Activated Sludge (CAS) | $1,200–$3,500 | ~$600,000 |
| Membrane Bioreactor (MBR) | $2,500–$6,000 | ~$1,500,000 |
| Sequencing Batch Reactor (SBR) | $1,800–$4,200 | ~$900,000 |
| Anaerobic Digestion | $3,000–$8,000 | ~$2,000,000 |
Custom site-built plants absorb more contingency for excavation, weather delays, and field welding. Modular trains trade some layout flexibility for faster mechanical completion. Most mid-size food plants we price lean modular when shutdown windows are short and yard space is already crowded with utilities.
OPEX Breakdown: The Hidden Costs of Organic Wastewater Treatment
Operational expenditure is usually the larger lifetime bill for organic wastewater plants, with energy and sludge disposal dominating most ledgers. Over a 10–15 year life, cumulative OPEX often exceeds the original CAPEX. Energy commonly accounts for 30–50% of biological-system OPEX once blowers, pumps, and mixers are metered together.
CAS aeration typically draws 0.6–1.2 kWh/m³. MBR trains often need 0.8–1.5 kWh/m³ once membrane scour air and higher transmembrane pressure are included. Sludge disposal is 25–35% of OPEX on many CAS plants at $0.50–$1.20/m³, while MBR sludge costs more often sit at $0.25–$0.60/m³ because observed yield is lower and the waste stream is more concentrated.
Pairing automated chemical dosing to optimize OPEX with a sludge dewatering systems to cut disposal costs by 30–50% shrinks those two lines together when polymer dose and cake solids are controlled. Chemicals—coagulants, polymers, disinfectant, and pH control—usually contribute 10–20% of OPEX at $0.10–$0.40/m³. Labor and maintenance add 5–15% at $0.05–$0.30/m³; automation can cut labor 40–60% on plants that previously relied on manual rounds.
Regional tip fees still swing the solids line hard. US landfill rates of $50–$120/ton and beneficial reuse at $30–$80/ton remain common planning bands. Many EU countries ban landfilling of organic waste, so disposal often runs €80–€200/ton and pushes plants toward advanced dewatering or digestion. China under GB 31573-2015 pressure sees sludge disposal roughly ¥200–¥500/ton. Variable-frequency drives on blowers and pumps can cut aeration energy 20–30% when dissolved-oxygen control is tuned to actual oxygen uptake rather than fixed speed.
| OPEX Component | Percentage of Total OPEX | Cost Range (per m³ treated) | Notes |
|---|---|---|---|
| Energy | 30–50% | CAS: 0.6–1.2 kWh/m³ MBR: 0.8–1.5 kWh/m³ |
Aeration, pumping, mixing |
| Sludge Disposal | 25–35% (CAS) 10–20% (MBR) |
CAS: $0.50–$1.20/m³ MBR: $0.25–$0.60/m³ |
Includes dewatering, transport, and final disposal |
| Chemicals | 10–20% | $0.10–$0.40/m³ | Coagulants, polymers, disinfectants, pH adjustment |
| Labor & Maintenance | 5–15% | $0.05–$0.30/m³ | Reduced significantly by automation |
Budget owners should also reserve membrane replacement on MBR trains and major blower overhauls on aerobic plants. Those are not monthly OPEX, yet they belong in the same ownership model as polymer and power. A five-year model that omits one membrane set understates true MBR cost of ownership.
MBR vs. CAS vs. SBR vs. Anaerobic: Which Technology Minimizes Costs for Your Organic Stream?
Technology selection for organic wastewater changes both CAPEX and long-run OPEX, so influent COD/BOD, footprint, and reuse targets must lead the shortlist. CAS, MBR, SBR, and anaerobic digestion each trade capital intensity, sludge yield, and effluent quality differently. MBR systems for high-organic streams with reuse-quality effluent fit tight sites that need TSS below 1 mg/L and COD often under 30 mg/L without a large tertiary filter hall.
| Parameter | CAS (Conventional Activated Sludge) | MBR (Membrane Bioreactor) | SBR (Sequencing Batch Reactor) | Anaerobic Digestion |
|---|---|---|---|---|
| CAPEX ($/m³/day) | $1,200–$3,500 | $2,500–$6,000 | $1,800–$4,200 | $3,000–$8,000 |
| OPEX ($/m³) | $1.20–$3.00 | $0.80–$2.50 | $1.00–$2.80 | $0.50–$2.00 |
| Footprint (m²/m³/day) | 0.5–1.2 | 0.2–0.5 | 0.4–0.8 | 0.8–1.5 |
| Sludge yield (kg/kg COD) | 0.3–0.5 | 0.1–0.3 | 0.2–0.4 | 0.05–0.2 |
| Effluent quality (mg/L) | TSS: 20–30 COD: 50–100 |
TSS: <1 COD: <30 |
TSS: 10–20 COD: 40–80 |
TSS: 50–100 COD: 100–200 (pre-treatment) |
Use-case matching:
- High COD/BOD (food processing, breweries, chemical plants): Anaerobic digestion with aerobic polishing often wins. Higher anaerobic CAPEX can be offset by biogas when COD is high and steady enough to keep methanogens fed.
- Limited space (urban plants, expansions): MBR footprint is typically 50–70% smaller than CAS, which matters more than the higher membrane CAPEX on constrained plots.
- Variable flows and loads (seasonal or batch production): SBR flexibility handles swings without a large equalization investment in many mid-size plants.
- Low-cost, large-scale secondary treatment: CAS still fits where land is cheap and discharge limits are moderate rather than reuse-grade.
One 1,000 m³/day chemical plant in Germany that moved from CAS to MBR cut sludge disposal cost about 45% and held EU reuse-quality targets more consistently. That pattern matches field reviews where haul fees and surcharge tables dominate the spreadsheet more than blower nameplate power. Rank technologies by compliance risk first, then by five-year cash flow, not by brochure CAPEX alone.
For high-strength streams, confirm whether anaerobic pretreatment is credited in both CAPEX and OPEX, or only mentioned as a future option. Biogas value only belongs in the payback math when gas use or export is already contracted. Otherwise keep anaerobic CAPEX in the model and leave revenue at zero until the offtake is real.
How does a wastewater CAPEX calculator work?
A wastewater CAPEX calculator converts capacity, process type, and unit rates into installed capital, then pairs that figure with annual OPEX savings to estimate payback. Start with the $/m³/day bands above, multiply by design flow, and add membranes, install, and contingency for your region. Next estimate annual energy, sludge, chemical, and labor lines with local tariffs rather than catalog defaults.
Savings and revenue close the model. MBR sludge disposal is often 30–50% lower than CAS on the same COD mass load. Reuse can offset freshwater at roughly $0.50–$2.00/m³ where industrial water is metered. US non-compliance exposure commonly sits in a $10,000–$50,000 per violation planning band for budgeting risk, not as a promised fine schedule. Anaerobic projects add biogas value when methane can displace purchased fuel or on-site power.
Payback in years equals incremental CAPEX divided by annual OPEX savings plus reuse or biogas revenue. For India-specific labour and civil unit rates, the same structure appears in the linked capex and opex breakdown; swap only the local unit costs, not the math. Keep peak-hour power charges and polymer freight in the calculator or the payback drifts optimistic.
ROI example for a 500 m³/day food plant
Return on investment for organic wastewater upgrades is clearest when you compare incremental CAPEX with annual savings on the same flow and COD basis. The worked example below uses the article’s US food-plant assumptions for a 500 m³/day facility moving away from high municipal surcharges.
- Estimate CAPEX: use the technology ranges and 500 m³/day examples above as the starting capital.
- Estimate annual OPEX: fold in energy, sludge, chemicals, and labor at your tariff set.
- Add savings and revenues: sludge reduction, freshwater offset, avoided fines, and biogas where applicable.
- Compute payback: Payback (years) = CAPEX / (Annual OPEX Savings + Revenue from Reuse).
CAS case: estimated CAPEX $1.1M; annual OPEX at $1.80/m³ equals 500 × 365 × $1.80 = $328,500/year.
MBR case: estimated CAPEX $1.8M; annual OPEX at $1.20/m³ equals $219,000/year. Water reuse credit at $0.20/m³ on 20% of flow adds about $36,500/year. Additional surcharge and compliance savings are estimated at $50,000/year on this example site.
Incremental CAPEX is $1.8M − $1.1M = $700,000. Annual OPEX savings are $328,500 − $219,000 = $109,500. Total annual benefit is $109,500 + $36,500 + $50,000 = $196,000. Payback is $700,000 / $196,000 ≈ 3.57 years.
Most food plants we review land between 3 and 7 years when reuse is only partial and sludge fees stay high. If freshwater is cheap and landfill tips are low, the same MBR premium can stretch beyond seven years and CAS or SBR may remain the rational pick.
Who this is for / next step
This guide is for plant engineers, EPC cost estimators, and procurement teams comparing CAS, SBR, MBR, or anaerobic options on organic industrial wastewater. Look elsewhere if you need municipal drinking-water CAPEX only, or if your stream is dominated by metals rather than COD/BOD. Selection checklist before you freeze the process block:
- Design flow and peak factor (m³/day)
- Influent COD/BOD and expected variability
- Discharge versus reuse quality targets
- Available footprint (m²) and civil constraints
- Local power tariff and sludge tip fee
- Membrane replacement cycle if MBR is shortlisted
- Automation level needed to hold labor OPEX down
If you already have flow, COD, and discharge limits, request a free quote with those parameters so capital and operating costs can be sized to your site rather than to generic bands.
Frequently Asked Questions
What is the average cost per m³ for treating organic wastewater?
Costs typically range from $0.80 to $4.50/m³ depending on technology, influent COD/BOD, and regional energy or sludge fees. MBR trains often average $1.20–$2.50/m³, while CAS more often sits at $1.20–$3.00/m³ under similar organic loads. Always normalize quotes to the same flow and COD before you compare vendors.
How much does sludge disposal add to OPEX?
Sludge disposal often represents 25–35% of OPEX on CAS systems, roughly $0.50–$1.20/m³ including dewatering and haul. MBR plants with lower sludge yield more often see 10–20% of OPEX, or about $0.25–$0.60/m³. Regional tip fees and beneficial-reuse options can move those bands more than the biology itself.
Is MBR more expensive than CAS for high-organic industrial wastewater?
MBR CAPEX is usually higher at $2,500–$6,000/m³/day versus $1,200–$3,500/m³/day for CAS. Lower sludge OPEX and reuse-ready effluent often flip total cost of ownership within about 3–7 years on high-organic industrial streams. The crossover point depends mainly on landfill fees, freshwater price, and whether membranes are required for compliance.
What are the biggest cost drivers in biological organic treatment?
The three largest drivers are sludge disposal (often 25–35% of CAS OPEX), aeration energy (commonly 30–50% of biological OPEX), and reuse or pretreatment upgrades that can add $0.30–$0.80/m³. Membrane replacement is an extra MBR-specific line that must be booked in year-five and year-ten cash flows. Ignoring any one of these three lines usually breaks the ROI model.
Can automation cut operating cost on organic wastewater plants?
Yes. PLC dosing, membrane scour control, and centralized monitoring typically cut labor 40–60% and chemical waste about 15–25%. Those controls often save $0.10–$0.30/m³ on plants that previously ran manual setpoints. Automation does not replace solids-handling CAPEX, but it stabilizes the OPEX lines that otherwise drift after commissioning.