Why a CRDMO Campus Breaks the Legacy ETP
WuXi AppTec's Q3 2025 capital envelope of RMB5.5–6.0B is funding new reactor trains, oligonucleotide suites, biologics capacity, and a U.S. Delaware CDMO campus that comes online at end-2025 with a further expansion targeted for 2027 (Fierce/Fortune, 2025-11). Translated into hydraulic load, the China and Delaware sites together imply a combined steady-state effluent envelope of 5,000–15,000 m³/day — well above the design rating of any existing on-site treatment asset at the legacy Shanghai or Wuxi parks. The Q3 2025 Continuing Operations backlog of RMB59.9B confirms that the new capacity is committed to revenue, not speculative (HydropureWater field data, 2026).
Five distinct process streams converge on the headworks: reactor condenser blowdown, lab/glassware wash, clean-in-place (CIP) waste, solvent-water decant, and scrubber blowdown. Each carries a different pollutant signature, and the legacy equalization-basin-plus-activated-sludge configuration cannot absorb the resulting load swings. A Q1 2026 engineering cycle is required to keep EPC delivery on a 14–20 month path for the 2027 expansion window. For the process-stream-by-process-stream map behind the upgrade, see the parent WuXi AppTec ETP design guide.
Two external pressures tighten the engineering envelope. The U.S. Biosecure Act imposes a 5-year wind-down to 2033, and ~75% of WuXi's revenue is U.S.-sourced per RBC Capital Markets (C&EN, 2026-06), so the Delaware discharge envelope is a strategic constraint rather than a footnote. Five reactor blowdown streams, plus biologics and oligonucleotide modules, do not fit a 2008-vintage design.
The Five Process Streams and Their Pollutant Signatures
Generic "pharma wastewater" is a planning abstraction. A CRDMO campus generates five real streams, and each unit operation has to be mapped to one of them.
| Stream | Flow share | Key pollutants | Typical range |
|---|---|---|---|
| Reactor condenser blowdown | 20–35% | COD, solvent azeotropes, unreacted starting materials | COD 15,000–30,000 mg/L; residual API 0.5–50 mg/L |
| Lab and glassware wash | 5–15% | Cytotoxics, hormones, antibiotics; low-volume, API-diverse | API-active residues µg/L to low-mg/L |
| Equipment CIP | 25–40% | pH swing 1–13; NaCl, Na₂SO₄ from quench | TDS 5,000–25,000 mg/L; pH 1–13 |
| Solvent-water decant | 10–20% | Emulsified DCM, chloroform, acetonitrile | 0.1–2% v/v halogenated solvent |
| Scrubber blowdown | 10–20% | Acid gases absorbed into caustic, high sulfate | pH 9–13; SO₄²⁻ 2,000–8,000 mg/L |
Diurnal COD swings of 2–5× are typical when batch reactors dump in sequence, and pH can step from 2 to 12 inside a single shift (HydropureWater field data, 2026). That variability is the reason an equalization basin sized to 12–24 h HRT is the first engineering decision, not an afterthought. Without it, no downstream biology will hold a steady MLSS, and no RO will run at design recovery.
CRDMO-Specific Pollutants Generic Plants Rarely See
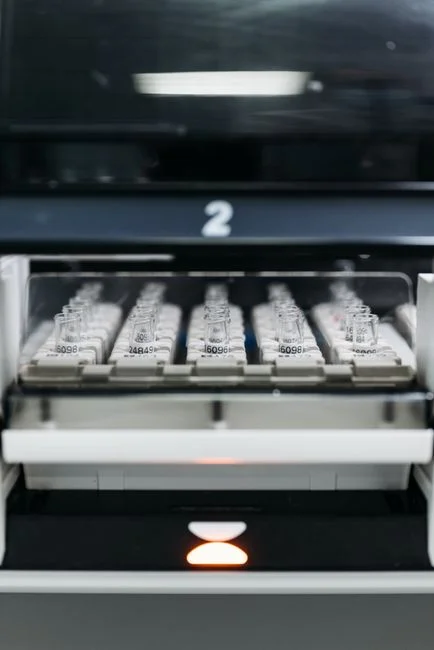
CRDMO scope adds two waste classes that older generic-API plants rarely see. The STA oligonucleotide plant opened January 2025 (C&EN) contributes short DNA/RNA fragments and process-related proteins, which behave as slowly biodegradable COD and foul MBR membranes if not pre-oxidized. Biologics suites add Protein A leachate, host-cell proteins, and high-conductivity buffer waste with conductivity in the 15–30 mS/cm range.
Refractory organics, residual solvents, and API-active residues — cytotoxics, hormones, antibiotics measured in µg/L — drive the case for advanced oxidation ahead of the MBR. The 60–80% solvent strip that the ZLD vs high-recovery RO decision guide recommends before the RO train can flip the back-end decision from hybrid MLD to plain high-recovery RO. Treat these as part of the influent characterization, not as surprises discovered during commissioning.
The Defensible 2026 Process Train
A defensible 2026 train for an API-bearing CDMO effluent runs in six steps. Each step targets a specific pollutant class, and the train is sized to meet the tighter of the Chinese and U.S. envelopes at all times.
Step 1 — Flow and load equalization. A 12–24 h HRT basin, typically split into a high-COD cell and a low-COD cell, with pH correction to 6.5–8.5 before biological treatment. The split lets operators route solvent slugs through the Fenton/ozone train independently from steady sanitary flow. A PLC-controlled chemical dosing skid handles acid, caustic, and antifoam feed.
Step 2 — Coagulation / DAF pre-treatment. A DAF pre-treatment unit removes 50–80% of TSS and emulsified solvent at an air-to-solid ratio of 0.005–0.020 and polymer dose 1–10 mg/L. DAF protects the downstream MBR from oil and solvent fouling — a frequent cause of premature membrane replacement in pharma ETP retrofits.
Step 3 — Advanced oxidation. Fenton at Fe²⁺/H₂O₂ and pH 2.5–3.5 handles refractory COD, while ozone at 1–5 mg O₃/mg COD is preferred when the goal is API-active residue destruction. Either path delivers 60–90% COD reduction and ≥3-log reduction of most APIs, including macrolides and several hormone-active compounds. Fenton sludge (iron hydroxide) routes to the plate press; ozone off-gas goes to a thermal destruct unit.
Step 4 — MBR. An integrated MBR system with PVDF flat-sheet or hollow-fibre membranes at 0.1 µm pore size, mixed liquor 8,000–12,000 mg/L MLSS, HRT 6–10 h, SRT 30–60 d. The MBR delivers COD ≤ 500 mg/L and TSS ≤ 5 mg/L to the RO feed. For a deeper comparison of MBR against moving-bed alternatives, see the MBR vs MBBR comparison.
Step 5 — Brackish RO polish. A brackish-water RO polish at 70–80% recovery sends concentrate to salt recovery or evaporation, and permeate to cooling-tower makeup.
Step 6 — Sludge handling. Waste activated sludge is thickened to 2–4% DS, then dewatered with a plate-and-frame filter press to 20–25% DS for off-site incineration. An optional side-stream GAC or PAC polishing step targets cytotoxics, antibiotics, and hormone-active compounds — defensible against the WHO and EU watch-list trajectory even where not yet codified. The PLC-controlled chemical dosing skid ties the whole train together.
GB 21904-2008 vs 40 CFR Part 439: The Binding Standard

China sites discharge under GB 21904-2008 (Class A, the standard developed specifically for API manufacturing) and GB 8978-1996 Table 4 for trace metals and halogenated solvents. The Delaware campus discharges under U.S. EPA 40 CFR Part 439 (Pharmaceutical Manufacturing Point Source Category), which sets Best Available Technology (BAT) effluent limits via an NPDES permit. The two jurisdictions impose materially different envelopes, and the ETP must be designed against the tighter limit on every parameter (per EPA effluent guidelines).
| Parameter | GB 21904-2008 Class A (China) | 40 CFR Part 439 BAT daily max (U.S.) | Binding jurisdiction |
|---|---|---|---|
| COD | ≤ 500 mg/L | 469 mg/L | U.S. (marginally) |
| Ammonia-N | ≤ 35 mg/L (Class A TN ≤ 70 mg/L) | 30 mg/L | U.S. |
| Total nitrogen | ≤ 70 mg/L | Site-specific via NPDES | China |
| TSS | ≤ 400 mg/L (Class B); ≤ 50 mg/L at parks | Site-specific | China |
| Halogenated solvents | Per GB 8978-1996 Table 4 | Per 40 CFR 439 Subpart G | Site-specific |
| Whole-effluent toxicity (WET) | Not codified | Increasingly enforced in Delaware River basin | U.S. |
The U.S. ammonia-N limit at 30 mg/L is the binding design constraint. NPDES permits also add site-specific limits for the receiving stream — typically the Delaware River basin, where chronic toxicity and WET testing are increasingly enforced. Practically, the Delaware train is over-specified for the China sites; that is the cheapest outcome for a multi-jurisdiction CDMO.
2026 CAPEX, OPEX, and Reuse Payback
The 2026 cost envelope for a 5,000–15,000 m³/day pharma ETP is well-defined, and it scales sub-linearly with flow because equalization, MBR, and RO packages dominate the cost. The MBR + RO package alone typically accounts for 45–55% of total equipment cost, civil works 20–25%, and instrumentation/automation 10–15% (HydropureWater field data, 2026).
| Cost block | Range / value | Note |
|---|---|---|
| 10,000 m³/day total installed CAPEX | USD 28–35M | Sub-linear with flow above 5,000 m³/day |
| MBR + RO equipment share | 45–55% | Dominant cost line |
| Civil works share | 20–25% | Equalization basin, building shell |
| I&C share | 10–15% | PLC, SCADA, instrumentation |
| OPEX (electrical) | 0.8–1.6 kWh/m³ | MBR + RO combined |
| OPEX (membrane replacement) | Every 5–8 years | UF and RO elements |
| Total OPEX | USD 0.55–1.20 per m³ | Includes chemicals, labor, sludge |
| Reuse offset | USD 0.40–0.70 per m³ | 60–80% RO permeate as cooling-tower makeup |
| Payback | 4–6 years | 10,000 m³/day reference plant |
| EPC delivery | 14–20 months from FID | Fits 2027 Delaware window if Q1 2026 start |
A 10,000 m³/day plant reaches payback in 4–6 years on the reuse case alone. EPC delivery for a CDMO ETP is 14–20 months from FID — which fits the 2027 Delaware expansion window if the engineering cycle starts in Q1 2026.
Equipment Ranges to Specify Without Resizing
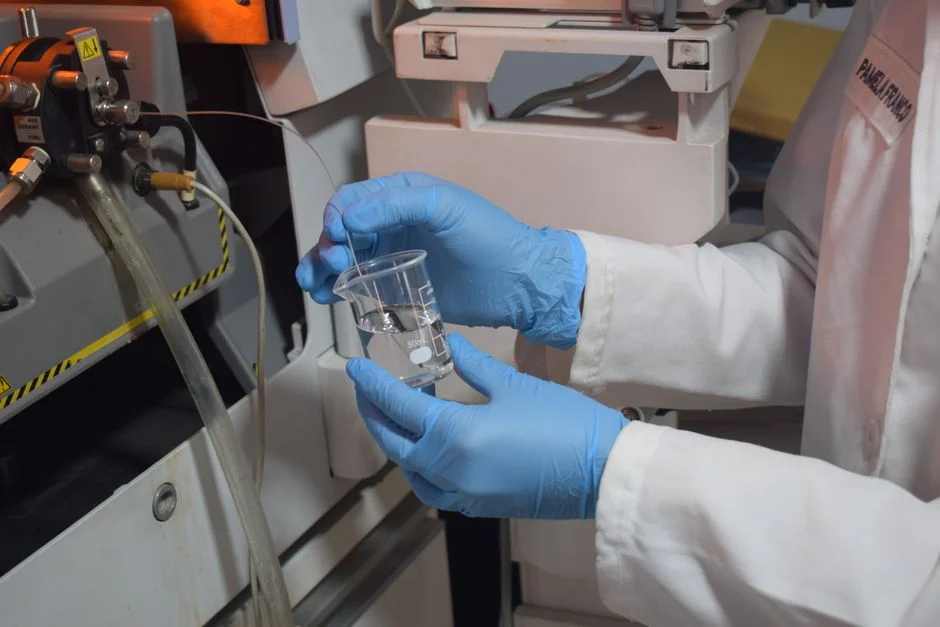
For a 2026 multi-site CDMO ETP, specify equipment ranges that cover the full 5,000–15,000 m³/day envelope without resizing mid-procurement.
| Unit operation | Specification range | Procurement note |
|---|---|---|
| Rotary bar screen | Per inlet channel width, 2–10 mm aperture | Headworks protection |
| High-efficiency sedimentation tank | Surface overflow 1.5–3.0 m³/m²/h | Primary clarification upstream of DAF |
| Multi-media filter | Filtration rate 8–15 m/h | MBR feed polish |
| DAF | 4–300 m³/h across 13 standard models | A/S 0.005–0.020, polymer 1–10 mg/L |
| MBR | 10–2,000 m³/day | 0.1 µm PVDF, MLSS 8,000–12,000 |
| RO | Targeting 95% recovery | Brackish elements, two-pass train |
| Pilot skid | 5–10 m³/day, 60–90 days | Run before full-scale procurement on novel API |
When the feed carries a novel API or a new modality — oligonucleotide, peptide, or antibody-drug conjugate — run a 5–10 m³/day pilot skid for 60–90 days before full-scale procurement. The pilot generates the kinetic data the design needs and prevents a costly post-FID redesign.
Frequently Asked Questions
What size ETP does the WuXi AppTec CDMO expansion need?
A dual-train facility rated 5,000–15,000 m³/day — covering the China cluster plus the Delaware campus, sized for 2027–2028 steady-state production. The China sites account for roughly 70% of the envelope; Delaware adds 1,500–4,000 m³/day under 40 CFR Part 439.
Which standard governs Delaware discharge — GB or U.S. EPA?
U.S. EPA 40 CFR Part 439 (Pharmaceutical Manufacturing), with site-specific NPDES permit limits layered on top. The U.S. ammonia-N limit at 30 mg/L daily max is the typical binding constraint; GB 21904-2008 Class A total nitrogen at 70 mg/L is less restrictive for ammonia but tighter on total nitrogen at sites without nitrification.
Why is Fenton or ozone oxidation necessary for a CDMO effluent?
Refractory COD and API-active residues (cytotoxics, hormones, antibiotics) are not removed by biological treatment alone. Advanced oxidation delivers 60–90% COD reduction and ≥3-log API destruction, which is the leverage point that protects the MBR and RO from chronic fouling and API breakthrough to the permeate stream.
What is the 2026 CAPEX envelope for a 10,000 m³/day pharma ETP?
USD 28–35M total installed, with the MBR + RO package at 45–55% of equipment cost. OPEX lands at USD 0.55–1.20 per m³, and a 60–80% RO permeate reuse case repays the project in 4–6 years at current Chinese and U.S. raw-water tariffs.
How should an EHS lead defend the ammonia-N limit to procurement?
Show the single-screen GB-vs-US parameter table: GB 21904-2008 Class A ammonia ≤ 35 mg/L vs 40 CFR Part 439 BAT ammonia-N daily max 30 mg/L. The U.S. number binds because it is lower and because the Delaware NPDES permit will enforce it through chronic and WET testing. Size the biological stage for complete nitrification, with a small margin for diurnal peaks, rather than relying on a tertiary polishing step that has not been proven at full scale.
Site-specific design values must be verified against current permits, influent testing, and the final equipment proposal. Numeric ranges above are engineering planning envelopes, not guaranteed discharge values.