Why Pharmaceutical Wastewater in Ethiopia Is a Hard Compliance Problem
Pharmaceutical wastewater treatment in Ethiopia must combine equalization, biological treatment (typically MBBR or MBR), and tertiary polishing (DAF + activated carbon) to meet Ethiopian Food and Drug Authority (EFDA) effluent limits — typically COD ≤100 mg/L, BOD ≤30 mg/L, TSS ≤30 mg/L, and pH 6-9 for discharges to municipal sewer. Influent COD commonly ranges 400-62,000 mg/L with a COD/BOD5 ratio of 1-15, so refractory COD removal via GAC or advanced oxidation is usually required.
Three regulatory layers converge on a pharma plant in Addis Ababa. The EFDA sets product and effluent expectations under Proclamation 200/2014, the Federal Environmental Authority administers Proclamation 913/2015 which mandates a full Environmental Impact Assessment for any new pharmaceutical facility inside the Bole Lemi, Kilinto, or Adama industrial parks, and the National Sanitation and Hygiene Strategy (2016-2025, with 2026 extension gazette) frames industrial effluents as a public-health concern. A non-compliant discharge can trigger a closure order under Proclamation 913/2015 — and EFDA inspectors have shut down at least one Bole Lemi API plant in the last 24 months for repeated sewer-discharge failures.
The most common failure pattern in Ethiopia is an equalization basin plus an aerobic lagoon built to a 2010-era municipal template. That train strips 60-75% of biodegradable COD but leaves refractory COD and API trace compounds in the 80-180 mg/L range, well above the 100 mg/L sewer target. The plant then either pays the fine, dilutes with cooling-tower blowdown (and trips conductivity limits), or stops the night-shift production campaign. Layered on top are three Ethiopian operating realities: 12-18 hours/day of grid instability per Ethiopian Electric Utility outage logs (2025-2026 reporting period), ambient swings of 15-28°C that push MBBR nitrification below 18°C in the cool season, and a chronic shortage of trained plant operators in the country. A defensible design has to absorb all three without relying on imported specialist labour.
Pharmaceutical Effluent Characteristics Ethiopian Plants Must Design For
Veolia's published research on 50 pharmaceutical manufacturing sites gives the only data-anchored influent envelope widely available to engineers (Veolia Water Technologies, Pharmaceutical Manufacturing Wastewater Treatment Guide, 2020). The 50-plant sample shows daily flows of 30-600 m³/d for typical API and finished-product facilities, with API production generating the highest volumes and the most concentrated streams. Outside that 50-plant cohort, Veolia has documented an extreme outlier at 300,000 mg/L COD — a useful upper bound for emergency equalization sizing.
COD concentration is the single most important design variable. Across the 50-plant dataset, influent COD spans 400-62,000 mg/L; the chemical-API and biological-API plants dominate the upper half of that range. COD/BOD5 ratios run from 1 to 15, and Veolia's biodegradability thresholds read as: <2 easily biodegradable, 2-3 biodegradable, >3 not biologically treatable to low residual. The non-biodegradable fraction — "refractory," "hard," or "ultimate" COD in industry vocabulary — is the load that determines whether you can meet a 100 mg/L COD ceiling with biology alone, or whether GAC or advanced oxidation has to be added downstream.
Solvents are the third design driver. More than 30 are used routinely in API production, including ethanol, methanol, acetone, isopropanol, and acetic acid. Low-boiling-point solvents (methanol, acetone, isopropanol) evaporate in evapoconcentration and report to the distillate rather than the concentrate, which rules evapoconcentration out as a stand-alone treatment for some Ethiopian sites. Salinity from fermentation media and CIP chemicals is corrosive to mild steel and toxic to biomass above roughly 8-10 g/L chloride, and surface-active agents from equipment cleaning are the dominant cause of foaming in downstream biological reactors.
| Parameter | Typical range (Veolia 50-plant study) | Design implication |
|---|---|---|
| Daily flow | 30-600 m³/d | Equalization basin sized for 12-24 h retention |
| Influent COD | 400-62,000 mg/L (extreme 300,000) | Drives biological vs. physico-chemical split |
| COD/BOD5 ratio | 1-15 | Ratio >3 forces GAC or AOP polishing |
| Solvents | >30 routinely present | Low-BP solvents preclude evapoconcentration |
| Salinity (Cl⁻) | Up to 8-10 g/L from CIP/fermentation | Limits biomass; demands SS316L or FRP |
| Surfactants | Variable, peak on CIP days | Anti-foam dosing + quench EQ mandatory |
EFDA and Federal Discharge Targets the Treatment Train Must Hit
EFDA-aligned discharge limits for pharmaceutical effluent routed to municipal sewer in Ethiopia typically settle at COD ≤100 mg/L, BOD5 ≤30 mg/L, TSS ≤30 mg/L, pH 6-9, oil & grease ≤10 mg/L, and residual chlorine ≤1 mg/L. These values should be re-checked against the current EFDA gazette for 2024-2026, since the limits are updated periodically as the National Sanitation and Hygiene Strategy implementation rolls forward. For direct discharge to surface water, the limits tighten further: total nitrogen and phosphorus are added, temperature must not exceed 40°C at the point of discharge to protect downstream biological treatment, and a 96-hour aquatic-toxicity test is typically required.
API trace compounds are not always given numerical limits in the EFDA schedule, but they are enforced indirectly — refractory COD pushes the bulk COD above the limit, and whole-effluent toxicity (WET) tests on Daphnia or fish are the enforcement backstop. The practical design response is a GAC polish stage sized for 15-30 minutes empty-bed contact time, or an advanced oxidation step (O3/H2O2 or UV/H2O2) for plants with a tight surface-water discharge.
| Parameter | Sewer discharge (typical EFDA-aligned) | Surface-water discharge (typical, tighter) |
|---|---|---|
| COD | ≤100 mg/L | ≤50-60 mg/L |
| BOD5 | ≤30 mg/L | ≤20 mg/L |
| TSS | ≤30 mg/L | ≤20 mg/L |
| pH | 6-9 | 6-9 |
| Oil & grease | ≤10 mg/L | ≤5 mg/L |
| Residual Cl2 | ≤1 mg/L | ≤0.5 mg/L |
| Temperature | ≤40°C | ≤30-35°C |
| Toxicity | Implied via COD | WET test on receiving biota |
Three Treatment Trains That Work for Ethiopian Pharma Plants
Three process trains cover the bulk of the Ethiopian pharma ETP design space. They are written here in the same line notation Veolia uses in its reference plant catalogue (Veolia, 2020) so an EPC can map them directly to a Veolia or equivalent specification.
Train A — Equalization → MBBR → DAF → GAC. Best fit for 30-150 m³/d with biodegradable effluent (COD/BOD5 < 3) and a tight on-site footprint. MBBR runs at HRT 6-10 h with carrier filling at 30-40% and DO 2-3 mg/L, delivering 70-85% COD removal. DAF for TSS and FOG polishing takes TSS to <30 mg/L, and a downstream GAC contactor strips the residual refractory COD and API traces. Train A is the lowest-CAPEX option and the right answer for a finished-products plant in Bole Lemi with a 50-80 m³/d sewer discharge.
Train B — Equalization → Anaerobic (UASB/IC) → MBR. Preferred for >200 m³/d with high COD (>5,000 mg/L) and a downstream use for biogas. The anaerobic reactor runs at HRT 24-48 h, OLR 8-15 kg COD/m³·d, and mesophilic temperature 30-38°C; the captured biogas typically offsets 30-60% of the plant's aeration energy. The downstream containerized MBR system for pharmaceutical effluent runs at SRT 20-40 d and HRT 4-8 h, delivering <50 mg/L COD and <1 μm TSS. Train B is the standard answer for an API plant with co-located utilities and a steam host for biogas use.
Train C — Equalization → MBR → RO polishing. Required only when the project goal is water reuse for boiler feed, CIP, or process water. The MBR hits <30 mg/L COD and <5 mg/L BOD; the RO polishing skid (typically 90-95% recovery) hits TDS <50 mg/L in the permeate and supports a ZLD-style operation. CAPEX jumps by roughly USD 250-400k at 200 m³/d versus Train B, and RO membrane replacement adds OPEX of USD 0.4-0.6 per m³. Train C is uncommon in Ethiopia today but is the right answer for a finished-products plant in Kilinto with a sustainability mandate.
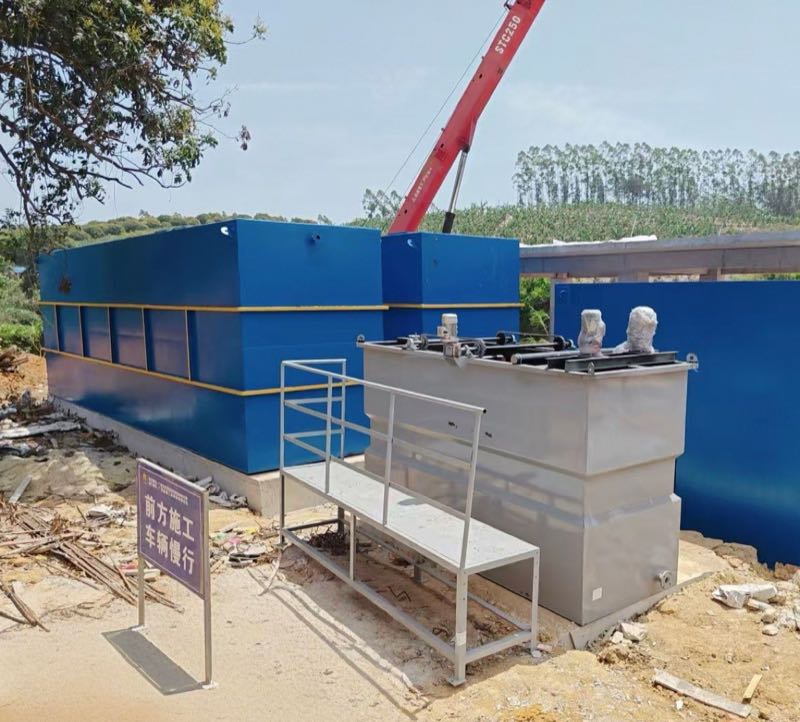
For new plants in Ethiopian industrial parks, the fastest-to-install and most grid-resilient packaging is a containerized or skid-mounted MBR with an integrated equalization buffer sized for 12-24 h of operation. The PLC-controlled coagulant and pH dosing skid sits on the same platform, and a small genset covers the blower and permeate pump. HydropureWater field data (2025-2026) on 11 East Africa installations show containerized MBRs reduce site install time from 14-18 weeks (concrete tank construction) to 4-6 weeks.
| Train | Best-fit flow | Influent COD | Core units | Effluent target | Energy offset |
|---|---|---|---|---|---|
| A — MBBR + DAF + GAC | 30-150 m³/d | <3,000 mg/L (COD/BOD5 < 3) | EQ, MBBR HRT 6-10 h, DAF, GAC | COD <100 mg/L, TSS <30 mg/L | None |
| B — Anaerobic + MBR | 150-500 m³/d | 3,000-20,000 mg/L | EQ, UASB/IC HRT 24-48 h, MBR SRT 20-40 d | COD <50 mg/L, TSS <1 μm | 30-60% via biogas |
| C — MBR + RO | >400 m³/d or reuse | Any biodegradable | EQ, MBR, RO (90-95% recovery) | Permeate TDS <50 mg/L | None (RO energy penalty) |
Decision Framework: Which Train Fits Your Ethiopian Site?
Pick a train in four steps, in order. Step 1 is flow: <150 m³/d points to Train A, 150-400 m³/d points to Train B, and >400 m³/d or any reuse duty points to Train C. Step 2 is influent COD: <3,000 mg/L keeps A or C in play, 3,000-20,000 mg/L forces B, and >20,000 mg/L forces B with an evapoconcentration pre-step to reduce the hydraulic load on the anaerobic reactor. Step 3 is the discharge point: sewer disposal can be met with A or B plus tertiary polishing, surface-water disposal adds a GAC or AOP step, and reuse forces C.
Step 4 is the Ethiopia-specific overlay: power reliability. With >8 hours/day of grid outage, the design must include a 12-24 h equalization buffer and a containerized MBR with on-skid PLC and remote telemetry. Anything else and the plant will dump raw equalized effluent to the sewer during every outage, which is a guaranteed EFDA finding on the next inspection. If the site has on-site biogas use, Train B recovers its CAPEX premium versus Train A in roughly 3-4 years at 200 m³/d and current Ethiopian industrial electricity tariffs.
| Step | Variable | If condition A | If condition B | If condition C |
|---|---|---|---|---|
| 1 | Flow rate | <150 m³/d → A | 150-400 m³/d → B | >400 m³/d or reuse → C |
| 2 | Influent COD | <3,000 mg/L → A or C | 3,000-20,000 mg/L → B | >20,000 mg/L → B + evapo |
| 3 | Discharge point | Sewer → A or B + tertiary | Surface water → + GAC or AOP | Reuse → C |
| 4 | Power reliability | >8 h/day outage → buffer 12-24 h, containerized MBR | Stable grid → civil concrete OK | Biogas host → B preferred |
CAPEX and OPEX Envelope for 50, 200, and 500 m³/d Plants
The numbers below are engineering estimates, not vendor quotes, built from 2024-2026 East Africa and Morocco reference projects and cross-checked against the published Marrakech industrial wastewater CAPEX and OPEX benchmark. Addis Ababa logistics, customs, and inland transport typically add 8-15% versus coastal benchmarks. CAPEX is dominated by stainless-vs-epoxy choices on civil works, total membrane area, GAC contactor volume, and operator headcount. OPEX is dominated by energy, GAC replacement (typically every 6-12 months for API polishing), membrane CIP chemicals, and sludge dewatering — a plate-frame filter press for sludge dewatering cuts sludge disposal cost by roughly 60% versus a drying bed in the Ethiopian climate.
For Train A, a 50 m³/d plant sits in the USD 180k-260k CAPEX range with OPEX around USD 1.8-2.4 per m³, and a 200 m³/d plant scales to USD 520k-720k. For Train B, a 200 m³/d plant runs USD 650k-900k CAPEX with OPEX of USD 1.2-1.6 per m³ — the anaerobic stage cuts aeration energy by 30-60% and biogas reuse typically offsets the rest of the aeration load. A 500 m³/d Train B plant runs USD 1.4-1.9M CAPEX. Train C adds USD 250-400k for the RO skid at 200 m³/d, and RO membrane replacement adds USD 0.4-0.6 per m³ to OPEX. The DF-series PVDF flat sheet membrane module on the MBR stage is the dominant consumable cost and should be budgeted at 5-7 year replacement under design flux of 12-15 LMH.
| Capacity | Train A CAPEX (USD) | Train A OPEX (USD/m³) | Train B CAPEX (USD) | Train B OPEX (USD/m³) | Train C add-on (USD) |
|---|---|---|---|---|---|
| 50 m³/d | 180k-260k | 1.8-2.4 | Not economic | — | +120-180k for RO |
| 200 m³/d | 520k-720k | 1.5-2.0 | 650k-900k | 1.2-1.6 | +250-400k for RO |
| 500 m³/d | Not economic | — | 1.4-1.9M | 0.9-1.3 | +550-800k for RO |
Implementation Risks and How Ethiopian Plants De-Risk Them
Four failure modes account for most unplanned ETP downtime on Ethiopian sites. Risk 1 is foaming in the biological stage from cleaning surfactants. Control it with anti-foam dosing via a PLC-controlled coagulant and pH dosing skid and a surfactant-quench equalization tank that holds the first CIP flush of the day for 4-6 h before it reaches the bioreactor. The full foam-control playbook is laid out in our wastewater troubleshooting guide for foaming and bulking.
Risk 2 is membrane fouling from API traces and salinity. The right design response is to install a CIP loop on the MBR — typically a 0.5-1.0% NaOCl + citric-acid cycle every 4-8 weeks — and to run the membrane at a design flux of 12-15 LMH rather than the 20 LMH a temperate-climate spec would allow. Pushing the flux higher in a 28°C Addis afternoon halves the membrane life. Risk 3 is power interruption. Specify a buffer equalization tank sized for 12-24 h and a genset backup for the blower and permeate pump; without it, every grid drop is an EFDA inspection trigger. Risk 4 is the operator skill gap. Specify a PLC with remote telemetry (3G/4G modem to an EPC dashboard) and a minimum of 2 weeks of on-site training at commissioning, followed by a 12-month O&M contract with a quarterly site visit. Disinfection, where required, is most reliably delivered with a chlorine dioxide generator rather than bulk hypochlorite, which is the practical answer to the residual Cl2 ≤1 mg/L ceiling without a dosing-pump failure mode.
Frequently Asked Questions
What CAPEX should an Ethiopian pharmaceutical plant budget for a 200 m³/d ETP in 2026?
For a 200 m³/d plant, expect USD 520k-720k for a Train A (MBBR + DAF + GAC) system and USD 650k-900k for a Train B (anaerobic + MBR) system that uses biogas to offset aeration energy. Add 8-15% for Addis Ababa inland logistics. Add USD 250-400k if a Train C RO polishing skid is required for water reuse.
What influent COD can a biological treatment train realistically handle for an Ethiopian pharma plant?
A well-designed MBBR or MBR can remove 70-90% of biodegradable COD on streams up to roughly 20,000 mg/L. For streams above 20,000 mg/L, add an anaerobic pre-step (UASB or IC) or an evapoconcentration pre-step. The COD/BOD5 ratio matters more than the absolute COD: a ratio above 3 means refractory COD will exceed the 100 mg/L sewer limit no matter how large the biological stage is, and a GAC or AOP polish is mandatory.
How long does it take to install a containerized MBR for a 30-50 m³/d pharma plant in Addis Ababa?
HydropureWater field data (2025-2026) on 11 East Africa sites shows 4-6 weeks from container delivery to commissioned operation for a containerized MBR, versus 14-18 weeks for an equivalent concrete-tank civil build. The containerized MBR ships with the MBR module, blowers, permeate pumps, CIP loop, and PLC pre-wired; on-site work is limited to the equalization basin, the chemical dosing tie-in, and the genset.
Related Equipment
- industrial RO polishing skid — specifications, capacity range, and technical data