
What Counts as Pharmaceutical Wastewater in a Kenyan Plant
Pharmaceutical wastewater (PWW) is any aqueous stream leaving an API synthesis hall, formulation suite, tablet-coating line, antibiotic fermentation bay, or clean-in-place (CIP) skid, often blended with on-site domestic sewage before it reaches the treatment plant. Dawood et al. (2023, DOI 10.37256/epr.3120232273) note that more than 3,000 active pharmaceutical ingredients are in commercial use, which is why PWW characterization cannot be copy-pasted from one site to another. At a typical Nairobi-area formulation plant, the waste stream carries residual solvents (methanol, acetone, dichloromethane), surfactants from coating operations, suspended pill fragments, cleaning caustic, and intermittent batch discharges from antibiotic reactors.
The mixed-origin nature of the stream matters for design. Blackwater from staff washrooms and kitchens raises ammonia and pathogen loading, which is why most Kenyan PWW plants are now sized for a full biological stage with disinfection rather than simple physico-chemical treatment. Equally important is the "pseudo-persistence" risk: antibiotics, analgesics, hormones, and contrast agents survive conventional activated sludge and end up in receiving waters, so tertiary polishing — typically MBR followed by RO or an advanced oxidation step — is no longer optional for any plant aiming at reuse. For sites that co-treat hospital or staff blackwater, a packaged underground integrated sewage treatment unit upstream of the main train keeps fecal coliforms in check without doubling the civil footprint. Readers cross-checking against a non-pharma baseline can also look at a generic industrial wastewater compliance reference for the kind of audit logic regulators apply.
Kenya's 2026 Compliance Landscape: EMCA, NEMA, KEBS, and Reuse Targets
Every 2026 PWW design in Kenya is anchored to the Environmental Management and Coordination Act (EMCA, Cap. 387) and the National Environment Management Authority (NEMA) effluent quality regulations. The discharge pathway determines the numerical ceiling: NEMA's 2020 effluent quality standards set COD ≤ 50 mg/L, BOD₅ ≤ 30 mg/L, TSS ≤ 30 mg/L, oil & grease ≤ 10 mg/L, pH 6.0–9.0, and temperature ≤ 35 °C for discharge to a watercourse, with slightly relaxed values for sewer discharge to Nairobi Water & Sewerage Company. The sewer path still enforces fats/oils, pH, and temperature controls that directly drive equalization and DAF sizing.
For plants chasing closed-loop reuse, the binding target becomes KEBS KS EAS 12 (potable reuse) or, more realistically for boiler feed and CIP rinse, the WHO/KEBS industrial reuse envelope — turbidity < 1 NTU, TDS < 500 mg/L, and zero detectable E. coli. The 2024 Ekopak pilots at two European pharma sites confirmed that an RO- plus-disinfection polishing train can hit those reuse limits while staying under the discharge envelope, which is the same dual-compliance logic a Kenyan plant should adopt. Designers should always spec the train to the tighter of the two limits, so the same plant can flip between reuse and discharge as water tariffs or production volumes shift. A useful analog for what regulators look for is the oil and grease discharge limit compliance guide for Indonesia's Baku Mutu, which structures the same parameter trade-offs in a comparable way.
| Parameter | NEMA 2020 — Watercourse | NEMA 2020 — Sewer | KEBS Reuse Target |
|---|---|---|---|
| COD (mg/L) | ≤ 50 | ≤ 250 | ≤ 50 |
| BOD₅ (mg/L) | ≤ 30 | ≤ 150 | ≤ 10 |
| TSS (mg/L) | ≤ 30 | ≤ 250 | ≤ 5 |
| Oil & grease (mg/L) | ≤ 10 | ≤ 50 | ≤ 5 |
| pH | 6.0–9.0 | 6.0–9.0 | 6.5–8.5 |
| TDS (mg/L) | ≤ 2,000 | ≤ 2,000 | ≤ 500 |
| E. coli (CFU/100 mL) | — | — | 0 |
Influent Characteristics Kenyan PWW Plants Should Design For
Engineering-typical 2026 PWW influent ranges, drawn from peer-reviewed surveys and field audits of mid-size formulation plants, are: COD 1,500–8,000 mg/L, BOD₅ 800–4,000 mg/L, TSS 200–1,500 mg/L, TDS 2,000–10,000 mg/L, pH 4–9, temperature 25–40 °C, and oil & grease up to 300 mg/L. These are not design values — they are envelopes against which a process engineer should sanity-check their own jar tests and plant data. Dawood et al. (2023) report that published removal efficiencies for COD, BOD, TSS, and TDS across PWW techniques range from 20% to 95%, which is itself a flag: the technology choice, not the influent number, is what determines the outcome.
The toxicity drivers in Kenyan PWW are antibiotics (β-lactams, macrolides, tetracyclines), residual solvents (methanol, acetone, DCM), and surfactants from coating operations. These compounds constrain MLSS, depress nitrification, and force operators to design a robust equalization step with toxic-stripping capability — typically a sidestream PAC dose or a dedicated equalization tank with diffused aeration. A well-instrumented equalization stage also stabilizes pH, dampens batch surges from reactors, and gives chemistry control upstream of biology, which is why an automatic chemical dosing skid belongs at the head of the train, not retrofitted later. The single most important rule for a Kenyan site: do not copy these numbers into a P&ID without a pilot or jar test on the actual waste stream.
| Parameter | Typical Range | Design Driver |
|---|---|---|
| COD (mg/L) | 1,500–8,000 | Sizes equalization, biology, RO loading |
| BOD₅ (mg/L) | 800–4,000 | Sets MLSS and HRT in MBR |
| TSS (mg/L) | 200–1,500 | Drives DAF and screen sizing |
| TDS (mg/L) | 2,000–10,000 | Sets RO feed pressure and recovery |
| Oil & grease (mg/L) | ≤ 300 | Coats MBR membranes if under-stripped |
| pH | 4–9 | Equalization neutralization |
| Temperature (°C) | 25–40 | Affects biological kinetics and RO flux |
A 2026 Process Train That Actually Works in Kenya
The train that consistently hits < 50 mg/L COD at a Kenyan API or formulation plant in 2026 is a four-stage sequence: equalization → DAF → MBR → RO, with sludge dewatering and ClO₂ disinfection on the side streams. The logic is straightforward — equalize and screen to give biology a stable feed, float off oils and colloids that would foul membranes, polish biologically to < 5 mg/L TSS, and recover 65–75% of the flow as boiler-feed or CIP-grade reuse water through RO. Dawood et al. (2023) document MBR as a leading PWW technology precisely because it couples high BOD removal with the low TSS that protects downstream RO.
Stage-by-stage, the engineering envelope looks like this. Stage 1: equalization basin sized for 24–48 h HRT, with a GX rotary bar screen on the inlet to strip rags, pill fragments, and lint before they reach the pumps. Stage 2: a DAF unit rated at 1.5–2× peak hourly flow, paired with coagulant and polymer dosing to strip suspended solids, oils, and emulsions ahead of biology. Stage 3: submerged MBR systems with PVDF membranes, typically 0.1–0.4 μm pore size, achieving > 95% BOD removal and < 5 mg/L TSS — the key step that protects every downstream asset. Stage 4: an industrial RO polishing train operated at 65–75% recovery, with antiscalant dosing and a ClO₂ generator on the permeate line for residual disinfection. Waste activated sludge reports to a plate-and-frame sludge dewatering press targeting > 22% dry solids, suitable for hazardous-waste handling.
| Stage | Equipment | Function | Typical Performance |
|---|---|---|---|
| 1. Headworks | Bar screen, equalization tank | Buffer batch surges, strip rags | 24–48 h HRT, pH 6–9 |
| 2. DAF | DAF micro-bubble flotation | Remove TSS, oil & grease | 60–90% TSS, 70–95% O&G |
| 3. MBR | Submerged PVDF membrane | BOD/COD polishing, TSS cutoff | > 95% BOD, < 5 mg/L TSS |
| 4. RO | Brackish RO with ClO₂ | Reuse water, TDS cut | 65–75% recovery, < 500 mg/L TDS |
| Sludge | Plate-and-frame press | Cake for hazardous disposal | > 22% DS |
MBR vs SBR vs Conventional ASP: Choosing the Right Biological Stage
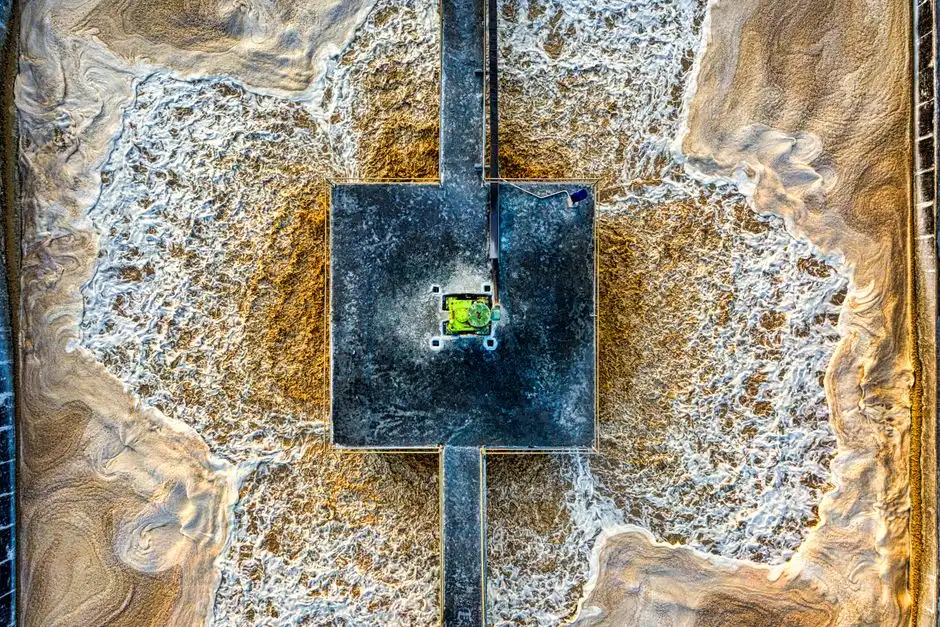
The biological stage is where most Kenyan PWW designs succeed or fail. Conventional activated sludge (ASP) is the cheapest CAPEX option but produces 10–30 mg/L TSS effluent, which forces a large downstream clarifier and fouls RO membranes quickly. Sequencing batch reactors (SBR) cut footprint by 30–40% versus ASP and suit low-flow, intermittent plants in the 20–100 m³/day range, but their TSS stability is weaker and the batch cycle complicates RO feed chemistry control. MBR combines a suspended-growth bioreactor with DF series flat-sheet MBR modules that deliver < 5 mg/L TSS, slash footprint by roughly 60% versus conventional ASP, and remove a wider slice of micro-pollutants — exactly the pseudo-persistent APIs that worry regulators.
For a Kenyan PWW plant in the 50–500 m³/day band — the typical size for an API or formulation facility in Industrial Area, Athi River, or Kikuyu — MBR is the 2026 default. It automates well, tolerates the upset loads that come with batch antibiotic production, and produces the low-TSS, low-SDI feed that an RO membrane needs to survive its 3–5 year life. The 2026 MBR market data backs this up: buyers are consolidating around packaged MBR skids with factory-tested modules, which is the same procurement pattern visible in the 2026 MBR market outlook. For cost context, the MBR cost and compliance reference for UK plants shows how OPEX is dominated by aeration energy and membrane replacement, not by civil works.
| Criterion | MBR | SBR | Conventional ASP |
|---|---|---|---|
| Effluent TSS (mg/L) | < 5 | 10–20 | 10–30 |
| Footprint (vs ASP) | ~ 40% | ~ 60% | 100% |
| API/micro-pollutant removal | High | Moderate | Low–Moderate |
| RO protection | Excellent | Moderate | Poor |
| Best fit (m³/day) | 50–500 | 20–100 | > 200 |
| Automation complexity | High | Moderate | Low |
Sizing, Footprint, and Cost Drivers for a 50–200 m³/day Kenyan Pharma Plant
A defensible 2026 sizing envelope for a 50–200 m³/day Kenyan PWW plant is: equalization tank at roughly 50% of daily flow (so 25–100 m³ for a 50 m³/day line, scaling linearly), DAF unit rated at 1.5–2× peak hourly flow, MBR footprint of 200–400 m² including membrane cassettes and aeration blowers, and RO recovery held at 65–75% with two-pass design where boiler-feed quality is required. A high-efficiency sedimentation tank ahead of the DAF is a common addition when the influent carries heavy suspended loads from CIP discharges. The biological stage relies on the DF series flat-sheet MBR modules for predictable flux and cleanability.
Cost drivers, in order of impact, are: membrane replacement (MBR ~ 5–7 years, RO ~ 3–5 years), energy (MBR aeration typically 0.3–0.5 kWh/m³ plus RO high-pressure pumps at 0.6–1.0 kWh/m³), chemical dosing (coagulant, antiscalant, CIP chemicals, ClO₂), and hazardous-sludge disposal through a licensed NEMA-approved contractor. The single largest economic lever is reuse: replacing 30–50% of municipal intake with RO permeate typically outweighs every other line item on the OPEX side, which is why a 2026 design should be sized for reuse from day one, not retrofitted later. A useful structural analog for the civil/RO split is the hybrid DAF-RO-MBR reference design used in PCB plants, which faces the same API-equivalent contaminant spectrum.
Common Design Mistakes and How to Avoid Them
Four failure modes show up repeatedly on first-time Kenyan PWW designs. First, skipping equalization and feeding batch surges directly to the MBR — a 30-minute slug from an antibiotic reactor can crash MLSS, push ammonia past 20 mg/L, and force a week of recovery. Second, under-sizing the DAF for oil & grease from coating and formulation lines, which coats the MBR membrane surface and forces replacement two years ahead of schedule. Third, ignoring antibiotic toxicity: high-strength β-lactam or macrolide streams inhibit nitrifiers, and a sidestream PAC dose or a dedicated toxic-stripping equalization cell is often the difference between stable nitrification and chronic ammonia breakthrough. Fourth, designing to discharge-only and ignoring reuse, which leaves the plant paying full Nairobi Water tariffs on both intake and discharge when 30–50% reuse would have paid for the RO skid in under three years. For a packaged skid sized to a smaller clinic or hospital pharma line, the medical wastewater treatment unit shows the same design logic at a smaller scale.
Frequently Asked Questions
What is the standard four-stage process train for pharmaceutical wastewater treatment in Kenya in 2026?
The 2026 reference train is equalization with bar screening → dissolved air flotation (DAF) → membrane bioreactor (MBR) → reverse osmosis (RO) with ClO₂ disinfection, sized to hit NEMA 2020 effluent limits of < 50 mg/L COD, < 30 mg/L BOD₅, and < 30 mg/L TSS while delivering reuse water at < 500 mg/L TDS. The same train serves either sewer discharge or on-site reuse depending on operating mode. A practical skid reference is the submerged MBR system feeding an industrial RO polishing train.
Which Kenyan regulations govern pharmaceutical effluent in 2026?
Pharmaceutical effluent in Kenya is governed by the Environmental Management and Coordination Act (EMCA, Cap. 387), the Water Quality Regulations, and the NEMA 2020 effluent quality standards, which set COD ≤ 50 mg/L, BOD₅ ≤ 30 mg/L, TSS ≤ 30 mg/L, oil & grease ≤ 10 mg/L, pH 6.0–9.0, and temperature ≤ 35 °C for watercourse discharge. Plants targeting closed-loop reuse also reference KEBS KS EAS 12 for potable criteria, while sewer discharge to Nairobi Water adds fats/oils and pH controls that inform DAF and equalization sizing (per NEMA 2020 and EMCA Cap. 387).
What influent parameters should a Kenyan pharma plant design its biological stage for?
Engineering-typical 2026 design envelopes are COD 1,500–8,000 mg/L, BOD₅ 800–4,000 mg/L, TSS 200–1,500 mg/L, TDS 2,000–10,000 mg/L, pH 4–9, temperature 25–40 °C, and oil & grease up to 300 mg/L, with antibiotics and solvents as the toxicity drivers. Dawood et al. (2023) report published PWW removal efficiencies between 20% and 95% depending on technology choice, which is why every Kenyan site must run a jar test or pilot before final P&ID release rather than copy generic values.
Why is MBR preferred over SBR for a 50–500 m³/day Kenyan PWW plant?
MBR delivers < 5 mg/L TSS effluent, cuts footprint by roughly 60% versus conventional activated sludge, and removes a wider slice of pseudo-persistent APIs that survive SBR or conventional biology. The low-TSS, low-SDI feed it produces is what protects RO membranes and keeps the 3–5 year membrane life on plan, which is the dominant OPEX line. SBR remains a defensible choice below 100 m³/day where CAPEX matters more than RO membrane longevity, but MBR is the 2026 default for API and antibiotic plants.
How much of the treated flow can realistically be reused in a Kenyan pharma plant?
A well-operated MBR + RO train at a 50–200 m³/day Kenyan plant typically achieves 65–75% RO recovery, which translates to 30–50% of total plant water demand being offset by reuse once RO permeate is blended into boiler feed and CIP rinse loops. The 2024 Ekopak European pharma pilots confirmed the same recovery band is achievable on real API streams with strict quality limits. Replacing 30–50% of municipal intake is usually the single largest OPEX line item a Kenyan plant can influence.