
Why a Factory Expansion Forces an ETP Redesign
A Nestlé-tier food factory uses water in four distinct roles — as an ingredient, a cleaning agent, a Clean-in-Place (CIP) solvent and a coolant — and a capacity expansion lifts all four flows simultaneously. The wastewater stream that leaves the plant is still 99.9% water and only 0.1% solids, so hydraulic volume alone is not the design driver; the pollutant mass load is (per PMG Engineering, 2021). What changes after expansion is the concentration and variability of that 0.1%: more CIP cycles push surfactant load, temperature swings, pH excursions and FOG; new product SKUs broaden the range of sugars, starches and proteins entering the drain.
An ETP sized to the pre-expansion average load will be overloaded on peak days and out of compliance on BOD, COD and oil & grease even when average flow looks acceptable. Food-industry process engineering is typically framed around pH, BOD, COD, TSS, oil & grease, conductivity, TDS and colour (per PMG Engineering, 2021) — and the expansion event changes every one of those parameters. The conclusion is operational, not aspirational: re-derive the design basis from the new production schedule before evaluating any equipment list.
Build the New Design Basis: Flow, Loads, and Variability
The first engineering deliverable for an expansion ETP is not a layout drawing — it is a refreshed design basis. Four steps get the numbers on paper:
- Redefine design flow as peak-shift flow. Annual averages mask the CIP and product-changeover spikes that drive biology upsets. Equalisation tank volume is sized to dampen those spikes; equalisation is consistently identified as one of the most important practical components of an ETP because biological and chemical systems perform more reliably when flow and concentration are controlled (per WTE Infra, 2025).
- Rebuild the pollutant mass balance for the expanded schedule. Segregate high-strength streams (CIP final rinse, product-spill streams) from low-strength streams (cooling bleed, HVAC condensate). Stream segregation is a major efficiency lever because high-strength, toxic or concentrated streams should be identified separately rather than blended into one mixed influent (per WTE Infra, 2025).
- Set the discharge-or-reuse target. This single decision drives whether tertiary, UF or RO is needed, and it changes the biology selection downstream (per WTE Infra, 2025).
- Confirm the regulatory envelope. Local discharge limits, Nestlé-aligned water stewardship standards, and any 2026 tightening of FOG, total nitrogen or phosphate limits must be on the table before equipment is specified.
Run an influent characterisation lab campaign that covers pH, BOD, COD, TSS, oil & grease, TDS, conductivity, metals, colour and any product-specific contaminants (per WTE Infra, 2025). One composite sample is not enough — assess production-wise variations across a full week so the equalisation volume and biology capacity are sized to real peaks, not smoothed averages.
| Parameter | Typical pre-expansion range (food) | Post-expansion design target | Why it matters |
|---|---|---|---|
| pH | 5.5–9.0 | 6.5–8.5 at biology inlet | Outside 6–9 range, nitrification and biological oxidation collapse. |
| BOD (mg/L) | 800–2,500 | ≤30 at outlet (discharge); ≤5 (reuse) | Drives aeration tank volume and MLSS sizing. |
| COD (mg/L) | 1,500–5,000 | ≤250 discharge; ≤50 reuse | BOD/COD ratio tells you whether the stream is biodegradable. |
| TSS (mg/L) | 300–1,200 | ≤100 discharge; ≤1 reuse | Protects membranes and downstream filters. |
| Oil & Grease (mg/L) | 100–600 | ≤10 discharge | Coats biomass, blocks aeration diffusers; primary DAF removes 60–90%. |
| Temperature (°C) | 25–45 | <38 at biology inlet | Mesophilic biology loses activity above 40 °C. |
| Equalisation HRT (h) | 4–8 | 8–12 for high-CIP variability | Damps CIP-shift spikes; raw data, HydropureWater food-sector projects, 2026. |
The Four Treatment Stages an Expanded Food ETP Must Cover
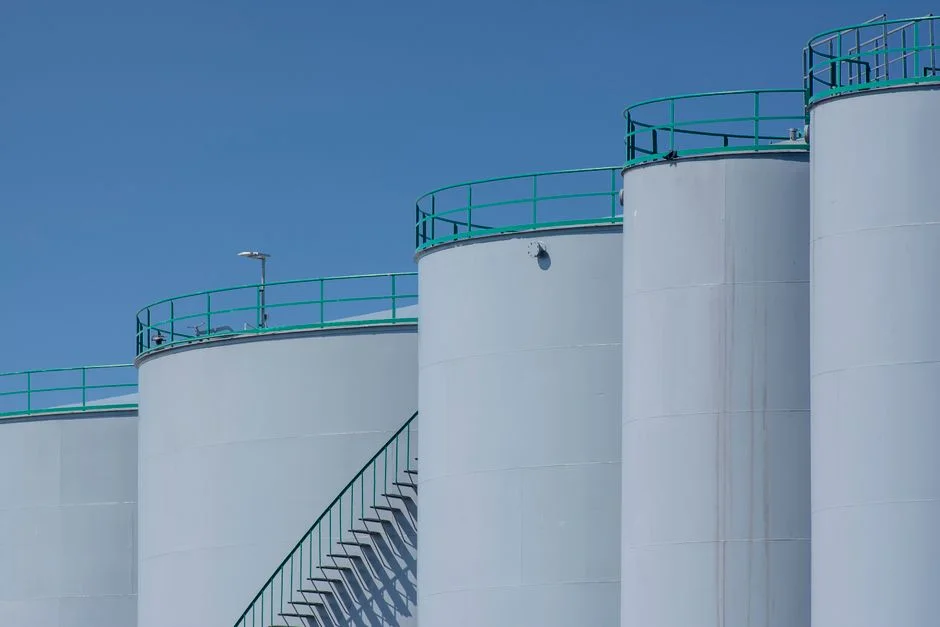
Every Nestlé-scale expansion ETP should be evaluated against a four-stage train; missing any stage is a known cause of post-commissioning underperformance (per NeoAkruthi, 2025).
- Preliminary: Bar screening to protect pumps and downstream biological units, plus grit removal (per NeoAkruthi, 2025). For high-FOG lines, a rotary mechanical bar screen with 3–6 mm aperture is typical. A purpose-built rotary bar screen for food-factory ETP prevents packaging fibres and product solids from carrying through to the aeration basin.
- Primary: Physical settling typically removes 50–60% of suspended solids, plus oil & grease, organic nitrogen, organic phosphorus and metals attached to solids (per NeoAkruthi, 2025). In food plants a DAF unit often replaces or supplements a primary clarifier because FOG floats rather than settles. A DAF for FOG and suspended solids achieves 60–90% oil & grease removal at hydraulic loading rates of 5–25 m³/m²·h when properly coagulated.
- Secondary: Biological treatment of biodegradable organics. Activated sludge remains the most common option, with MBBR, SBR and MBR as the main variants (per WTE Infra, 2025; NeoAkruthi, 2025). Screening, equalisation, biological treatment and sludge management are flagged as "particularly important" for food and beverage wastewater (per WTE Infra, 2025).
- Tertiary: Filtration, disinfection (chlorine, UV, ozone) and — where reuse is required — UF/RO polishing (per NeoAkruthi, 2025).
MBR vs MBBR vs SBR: Which Biology Fits a Nestlé-Scale Expansion
Biology selection drives footprint, CAPEX, OPEX and reuse capability. The three leading options behave very differently under post-expansion loads.
- MBBR uses biofilm on free-floating carrier media. It is robust to load variation, has a smaller footprint than conventional activated sludge and lower CAPEX than MBR (per WTE Infra, 2025).
- SBR runs biological reaction and clarification in a timed batch sequence. It handles variable influent well, has simpler hydraulics, but the cyclic control logic adds complexity and the footprint is larger than MBBR or MBR at the same load (per WTE Infra, 2025).
- MBR couples activated sludge with a submerged membrane at typically 0.1 µm pore size. It produces near-reuse-quality effluent, achieves roughly 60% smaller footprint than conventional activated sludge, but carries higher membrane cost and demands stricter pretreatment to prevent fouling (per WTE Infra, 2025).
For a Nestlé-type expansion where corporate water-stewardship targets push toward reuse — CIP pre-rinse, boiler feed, cooling-tower makeup — MBR is the default recommendation. Where reuse is not in scope and discharge is the only target, MBBR or SBR typically offer the lowest lifecycle cost. A packaged MBR system for food-factory ETP built around a submerged MBR membrane module is the common configuration for Nestlé-tier reuse loops; see also the engineering case for MBR for food processing.
| Criterion | MBBR | SBR | MBR |
|---|---|---|---|
| Footprint vs conventional ASP | ~40–50% smaller | ~30% smaller (cyclic) | ~60% smaller |
| Effluent TSS (mg/L) | 20–50 | 20–40 | ≤1 |
| Effluent BOD (mg/L) | ≤20 | ≤20 | ≤5 |
| Hydraulic retention time | 6–10 h | 12–24 h (cyclic) | 8–14 h |
| CAPEX relative | Low | Low–medium | High (membranes) |
| OPEX relative | Low | Medium | Medium (membrane cleaning, air scour) |
| Reuse suitability | Limited (needs tertiary) | Limited (needs tertiary) | Direct to RO/UF polishing |
| Load-variation tolerance | High | Medium | Medium–high |
For dairy-heavy lines, the underlying hydraulic and organic profile is similar enough that the same comparison holds; the practical differences in equipment selection are covered in dairy wastewater treatment methods.
Tertiary Polishing, Disinfection, and Sludge Handling
The ETP does not end at the clarifier — sludge must be collected, thickened, dewatered, stored and disposed of according to applicable requirements, and reuse-grade water needs polishing that secondary biology alone cannot deliver (per WTE Infra, 2025).
- Polishing: A lamella clarifier after the biological stage runs at 20–40 m³/m²·h surface loading and can cut coagulant use by up to 30% versus a conventional clarifier, per the 2026 lamella vs conventional clarifier comparison. A lamella clarifier for tertiary polishing typically precedes multimedia filtration and, if boiler-feed quality is required, RO.
- Disinfection: UV is the default for reuse loops that must avoid chlorine by-products; chlorine dioxide suits plant-wide microbial control; ozone is reserved for applications where colour or trace organics remain a concern.
- Sludge line: Thickening followed by dewatering. A filter press for sludge dewatering typically produces a 22–28% dry-solids cake from a food-industry activated-sludge feed, versus 18–22% for a screw press on the same feed. A packaged chlorine dioxide generator on the reuse loop controls biofilm without the trihalomethane risk of bulk chlorine dosing.
2026 Cost and Vendor-Selection Reality Check
There is no universal ETP price; the cost of a 1 KLD plant varies with wastewater characteristics, treatment technology, civil works, automation, membrane requirements and sludge handling, and a preliminary budget should be treated as project-specific rather than a generic per-KLD number (per WTE Infra, 2025). A plant with low flow but highly concentrated wastewater can cost more to operate per kilolitre than a larger plant with relatively dilute effluent, so the right unit of evaluation is ₹/kL (or $/m³) of treated water including chemical, energy and sludge costs — not the equipment line item.
Do not choose a vendor on equipment price alone. A technically cheaper system becomes expensive fast if it has high chemical consumption, unstable biology or weak service support (per WTE Infra, 2025). For a Nestlé-type buyer the due-diligence list should require: a P&ID, a full mass balance, a sludge balance, an automation philosophy document, and a contractual reuse-water quality guarantee tied to measurable parameters (TSS, BOD, conductivity, microbial counts). Anchor the comparison on the 2026 lamella clarifier benchmarks and on operating data from comparable food-sector references, not on catalogue kLD numbers.
Frequently Asked Questions
What capacity does the ETP need after a Nestlé-tier food factory expansion?
Capacity must be sized to the post-expansion peak-shift flow — the highest flow the plant will see on a CIP changeover day — not to the annual average. Equalisation volume is then added to damp the spike so the downstream biology runs on a smoothed load; 8–12 hours of hydraulic retention at peak flow is a common starting point for high-CIP food lines (HydropureWater food-sector project data, 2026).
Is MBR mandatory for a food-factory ETP expansion?
No. MBR is mandatory only when the treated water is intended for reuse at near-potable quality (CIP pre-rinse, boiler feed, cooling-tower makeup). For discharge-only compliance, MBBR or SBR deliver lower lifecycle cost at the same discharge quality.
How is FOG handled in a food-industry ETP?
FOG is removed in two stages: a DAF unit in the primary stage typically takes out 60–90% of incoming oil and grease, and any residual FOG is polished by biological oxidation downstream. The floated skimmings and waste activated sludge are thickened and dewatered through a filter press or screw press.
Can treated ETP water be reused for CIP?
Yes. A full reuse train typically runs MBR → UF → RO → UV or chlorine dioxide disinfection, producing water that meets CIP pre-rinse and final-rinse conductivity and microbial targets. The RO step is what brings TDS and conductivity down to the levels the CIP loop expects.
How long does an ETP expansion project take from design to commissioning?
For a Nestlé-tier greenfield ETP, expect roughly 8–14 weeks for design and engineering after the influent characterisation is complete, 12–20 weeks for procurement and fabrication of long-lead items (membranes, filter presses, control panels), and 6–10 weeks for civil works, installation and commissioning — so a realistic total is 8–12 months from kickoff to compliant discharge, longer if regulatory consent runs in parallel.