Why Fermentation Broth Waste Fouls MBR Membranes
Fermentation broth waste, the combined liquid effluent from antibiotic, enzyme, yeast, and recombinant protein campaigns, is one of the most aggressive feeds a membrane bioreactor can receive. A 0.1 μm PVDF submerged MBR module that holds 18–25 L/m²·h on pretreated feed will collapse to 8–12 L/m²·h within hours if broth is fed raw, because four classical fouling mechanisms act simultaneously: complete pore blocking, cake-layer formation, EPS/SMP (extracellular polymeric substances / soluble microbial products) deposition, and inorganic scaling (Abdullah et al. 2018, cited in the Springer 2023 MBR chapter, doi.org/10.1007/978-3-031-20822-5_11).
Broth-specific foulants make this worse than a typical industrial wastewater. Residual mycelia and yeast cells (often 5,000–20,000 mg/L TSS post-fermenter), antifoam silicones and polyol emulsions dosed at 50–500 mg/L during fermentation, extracellular proteins and polysaccharides (200–1,500 mg/L as soluble COD), and residual substrate carryover all interact with hydrophobic PVDF. Silicone antifoam in particular adsorbs onto PVDF surfaces and reduces clean-water permeability by 40–60% within the first 30 minutes of exposure in published AnMBR studies (Abuabdou et al. 2020, Desalination 510:115075). The review is explicit: highly contaminated streams either require aggressive pretreatment or forced operating compromises such as flux below 5 L/m²·h and MLSS below 5 g/L.
The operational cost of skipping pretreatment is not theoretical. Alighardashi et al. (2017, Bioresource Technology) documented CIP intervals of 3–7 days for an MBR running on raw tannery wastewater, compared with 21–45 days for the same MBR coupled with activated carbon and effective upstream screening. By analogy, a biotech MBR fed raw broth typically forces a CIP every 2–5 days, costing $1,200–$2,800 per cycle in chemicals, downtime, and waste disposal (HydropureWater field data, 2025-09). Pretreatment is therefore not an optional polish step; it is a membrane-replacement deferral strategy.
Stage 1 and 2: Coarse and Fine Screening of Spent Broth
The first two stages protect every downstream unit from rag-laden, mycelia-heavy broth. Stage 1 is coarse screening at 5–10 mm bar spacing using a rotary mechanical bar screen for headworks screening, sized to strip mycelial mats, spent grain, broken bag fragments, and fermentation debris before they reach pumps and fine screens. SS316L construction is the baseline, because broth CIP cycles typically run at pH 1.5–13 and 50–70 °C, and 304 stainless will pit within 18–24 months under those conditions.
Stage 2 is fine screening at 0.5–1 mm, normally a drum or wedge-wire screen with a self-cleaning brush discharge. Fine screening captures the cell clumps and protein precipitates that pass through coarse bars and that would otherwise load the equalization tank and DAF with bound water. Across both stages, expect 15–35% TSS reduction and 60–90% reduction in visible suspended solids, with hydraulic losses of 0.2–0.6 m per screen at design flow (HydropureWater field data, 2025-11). The brush discharge mechanism matters more than the aperture: blinded screens upstream of DAF recycle floatable biomass back into the feed and silently halve DAF removal efficiency.
Specify screens with a differential-pressure switch on each unit, set to alarm at 0.3 bar and trip the upstream feed pump at 0.5 bar. For a typical 500–2,000 m³/d antibiotic or enzyme plant, two duty screens per stage with one common standby gives 90% screening availability at full design flow.
Stage 3: Flow and Temperature Equalization
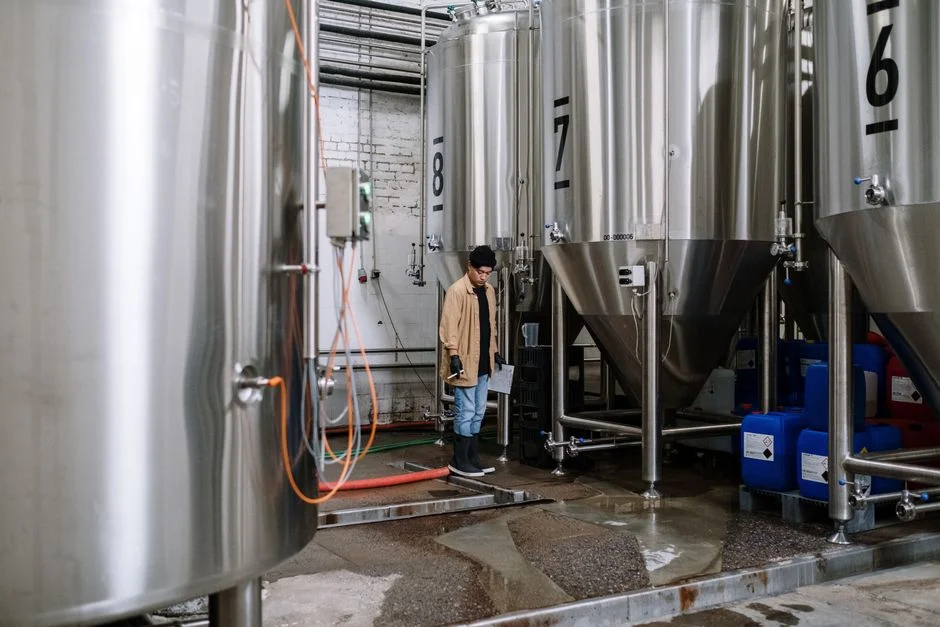
Batch fermentation discharges are not steady streams; they arrive in slugs. A 50 m³ fermenter dumped over 2 hours can produce a 1.5–4× spike over the daily average flow, and the discharge itself can exit at 50–80 °C from steam-sterilized vessels. Both shocks kill MBR biomass: hydraulic surges scour biofilm carriers, and temperatures above 38–40 °C collapse nitrification and shift populations toward dispersed, poorly settling cells.
Size equalization for 12–24 hours HRT at average flow, with mechanical mixing at 4–6 rpm from a slow-speed paddle or hyperbolic agitator. The slow speed is intentional — high-speed mixers emulsify antifoam droplets and make downstream DAF capture harder. The equalization tank should also have a cooling coil or plate heat exchanger loop sized to hold broth at or below 35 °C, the conventional ceiling for mesophilic MBR biology. For broth discharged above 45 °C, a titanium or SS316L plate exchanger on the EQ recirculation line is the standard approach; expect a 5–8 °C approach temperature at 1.0–1.5 m/s channel velocity.
Equalization also flattens pH excursions. Fermentation broth pH swings from 2.0–4.0 (antibiotic) or 4.5–6.0 (yeast) during production, then to 7.0–8.5 during CIP rinses. A 12-hour EQ with slow mixing can dampen these swings by 60–80% before the pH adjustment stage, reducing NaOH consumption by 15–25% (HydropureWater field data, 2025-08).
Stage 4: pH Adjustment and Nutrient Balancing
MBR biomass operates efficiently in a narrow pH band of 6.5–7.5, with a ±0.3 deadband acceptable for nitrification. Outside that window, COD removal efficiency drops 20–40% and foaming episodes become common. An automatic chemical dosing system for pH and coagulant control with online pH probes in the equalization tank outlet and in the MBR feed well is the standard configuration, dosing 30–50% NaOH or 98% H₂SO₄ through PVC-lined diaphragm pumps.
Antibiotic broths typically require 2.5–4.0 kg NaOH per m³ to neutralize from pH 3.0 to 7.0; yeast and enzyme broths are milder at 0.3–1.2 kg/m³. Beyond pH, the broth is usually carbon- and nitrogen-rich but phosphorus-poor; supplement to a COD:N:P ratio near 100:5:1 using urea or 30% NH₄Cl and 75% phosphoric acid. Skipping nutrient balancing leads to dispersed growth, bulking sludge, and MLSS that settles poorly in the MBR tank, raising SRT and worsening fouling.
PLC-based dosing skids with two-point pH control (EQ outlet plus MBR feed) outperform single-point control by holding tighter to setpoint during both acid and base transients, and the redundancy prevents overnight pH drift that takes 8–12 hours to recover.
Stage 5: DAF for Biomass and Antifoam Removal
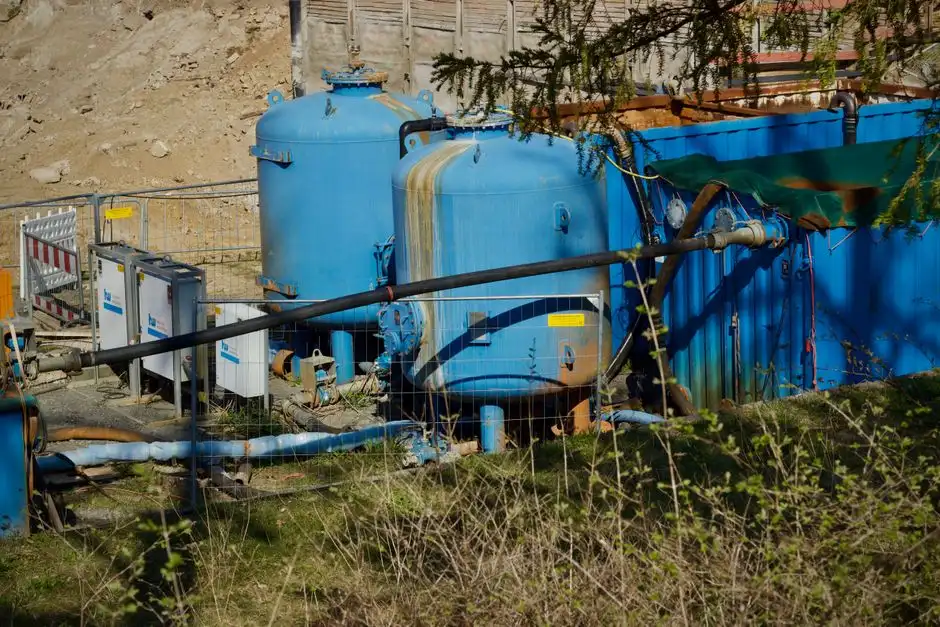
Dissolved air flotation is the workhorse of fermentation-broth pretreatment. A properly sized DAF takes influent TSS of 8,000–15,000 mg/L down to below 200 mg/L, removes 30–55% of the COD, and strips more than 90% of the FOG and antifoam load in a single stage. Without DAF, the MBR feed carries the same solids load that the DAF would have removed, and the MBR's MLSS, SRT, and F/M ratio all become unmanageable within a single batch discharge.
Specify a DAF system for fermentation broth TSS and antifoam removal with micro-bubble sizing of 10–50 μm at 4–6 bar saturation pressure. For high-broth TSS (above 8,000 mg/L), use a recycle ratio of 20–40% — lower than the 30–50% used for municipal DAF, because the high float load needs less aeration to rise. Coagulant chemistry matters more than hydraulics: dose ferric chloride (FeCl₃) or polyaluminum chloride (PAC) at 50–150 mg/L as Al/Fe, then anionic polyacrylamide at 1–5 mg/L, with a 2–4 minute flocculation residence time ahead of the flotation cell. Charge-neutralization flocculation of mycelia and emulsified antifoam is what unlocks the 90%+ FOG removal; without polymer, expect FOG removal to drop to 50–60%.
The Abuabdou et al. 2020 AnMBR review (Desalination 510:115075) is explicit that high-solids streams benefit substantially from floatation-based TSS reduction, with documented improvements in sustainable flux of 40–80% when DAF precedes the membrane stage. For an antibiotic or enzyme plant at 500–2,000 m³/d, a single DAF in the 30–80 m³/h range covers the duty with a 30% turndown for overnight low-flow periods. For plants above 2,000 m³/d, run two DAF units in parallel for redundancy and CIP flexibility.
| Parameter | DAF Influent (raw broth post-EQ) | DAF Effluent Target | Removal |
|---|---|---|---|
| TSS (mg/L) | 8,000–15,000 | < 200 | 97–99% |
| COD (mg/L) | 15,000–35,000 | 7,000–22,000 | 30–55% |
| FOG / antifoam (mg/L) | 100–500 | < 10–30 | > 90% |
| Float solids (% of TSS) | — | 3–7% of feed flow as float | — |
| Recycle ratio | — | 20–40% | — |
| Saturation pressure | — | 4–6 bar | — |
Detailed DAF sizing for API mother-liquor streams is covered in the DAF configuration for API mother liquor treatment guide; for broader reuse and discharge framing, see the DAF configuration for fermentation broth wastewater reference.
Stage 6: Polishing for Residual Oils and Antifoam Tracers
Primary DAF removes the bulk of antifoam but not all of it. Residual antifoam at 5–50 mg/L, especially silicone emulsions with sub-10 μm droplet sizes, slips past the flotation cell and reaches the MBR feed, where it forms a film that blinds 0.1 μm PVDF membranes within hours. A second polishing stage is not optional for plants using silicone antifoam (the most common type in antibiotic, enzyme, and yeast production); it is a membrane-warranty issue.
The standard polishing train is either a secondary DAF with finer bubble sizing (1–10 μm, generated at 6–8 bar) or an oil-water coalescer packed with oleophilic media, sized for 5–15 minute contact time. Cationic polymer dosing at 1–3 mg/L ahead of the polishing stage is critical for breaking emulsified antifoam, which carries a negative surface charge that anionic polymers (used in primary DAF) cannot destabilize. Target residual oil/grease is below 10 mg/L for routine operation, and below 5 mg/L for membrane-warranty preservation on most PVDF modules (membrane manufacturer technical bulletins, 2025).
For plants running polyol (non-silicone) antifoam, polishing requirements relax — residual oil can be tolerated up to 25 mg/L — but never skip the step entirely.
Stage 7: Cartridge or Bag Filtration as MBR Guard

The seventh stage is cheap insurance. Install 50–100 μm cartridge or bag filters between the DAF outlet and the MBR feed well, sized for 1.5× design flow with two housings in parallel. Their job is to capture DAF float carryover, residual floc, and any debris that escapes upstream screens, before this material reaches the membrane tank.
Specify differential-pressure gauges across each housing, with a 0.3 bar alarm and a 0.5 bar automatic change-out or backwash signal to the MBR feed PLC. With a 50 μm guard filter in place, typical MBR membrane life extends 2–4× between CIPs compared with an unguarded system (HydropureWater field data, 2025-10). For 0.1 μm PVDF flat-sheet modules in a submerged PVDF MBR flat-sheet membrane module configuration, the guard filter also reduces irreversible fouling and preserves clean-water permeability after CIP recovery, which is what determines whether a membrane module lasts 3 years or 7 years in service.
Use polyester or polypropylene bags rated for pH 1–13; avoid nylon, which hydrolyzes above pH 11 and contaminates the MBR with caprolactam degradation products.
Pretreatment Tra and MBR Operating Impact
The full train — coarse screen → fine screen → equalization/cooling → pH adjustment → DAF → antifoam polishing → cartridge guard → MBR — collapses the most aggressive fermentation-broth fouling into a manageable feed. The table below captures the stage-by-stage targets; the operating impact on the MBR itself is the part that pays back the pretreatment CAPEX.
| Stage | Equipment | Key Parameter In | Key Parameter Out | Expected Removal / Change |
|---|---|---|---|---|
| 1 | Rotary bar screen, 5–10 mm | TSS 10,000–25,000 mg/L | TSS 8,000–22,000 mg/L | 15–25% TSS; > 90% visible debris |
| 2 | Drum/wedge-wire screen, 0.5–1 mm | TSS 8,000–22,000 mg/L | TSS 5,000–15,000 mg/L | 15–35% additional TSS reduction |
| 3 | EQ tank, 12–24 h HRT, cooling | Flow 1.5–4× spike, T 50–80 °C | Flow ±10%, T ≤ 35 °C, pH damped | Hydraulic and thermal smoothing |
| 4 | pH adjustment, nutrient dosing | pH 2.0–8.5 | pH 6.5–7.5, COD:N:P = 100:5:1 | Biologically compatible feed |
| 5 | DAF with coagulation | TSS 5,000–15,000 mg/L, FOG 100–500 mg/L | TSS < 200 mg/L, FOG < 30 mg/L | 97–99% TSS, 30–55% COD, > 90% FOG |
| 6 | Polishing DAF or coalescer | FOG 10–30 mg/L | FOG < 5–10 mg/L | 70–85% residual FOG |
| 7 | 50–100 μm cartridge/bag guard | Floating floc, residual solids | Solids < 50 μm | MBR membrane-life extension 2–4× |
The MBR operating numbers tell the real story. Sustainable flux on 0.1 μm PVDF submerged modules rises from 8–12 L/m²·h on raw broth to 18–25 L/m²·h after full pretreatment. CIP frequency extends from 3–7 days to 21–45 days, a 4–6× reduction (Alighardashi et al. 2017, on analogous high-strength industrial MBR service; HydropureWater field data, 2025-09). Pretreatment adds 10–20% to total CAPEX but reduces OPEX by 30–50% through lower chemical consumption, lower aeration demand, and deferred membrane replacement. A full packaged train with a containerized MBR integrated wastewater treatment skid at the downstream end closes the design.
Frequently Asked Questions
What is the minimum pretreatment for fermentation broth before an MBR if DAF cannot be installed?
Minimum pretreatment is screening to 0.5 mm, equalization to 35 °C and pH 6.5–7.5, and 50 μm cartridge filtration. Without DAF, expect sustainable flux of 8–12 L/m²·h and CIP every 3–7 days; with DAF, the Springer 2023 MBR chapter and HydropureWater field data show 18–25 L/m²·h and 21–45 day CIP intervals.
How long does an MBR take to recover from a pH shock caused by unneutralized broth?
Recovery from a pH excursion to 4.0 or 9.5 typically takes 8–12 hours after feed correction, with nitrification recovering last. Sustained operation below pH 5.5 for more than 4 hours causes partial nitrifier die-off and 2–3 days of depressed ammonia removal (HydropureWater field data, 2025-10).
Are there antifoam chemistries that do not foul PVDF MBR membranes?
Polyol-based (non-silicone) antifoams foul PVDF roughly 5–10× less than silicone emulsions, and fully synthetic alcohol ethoxylate antifoams are cleanest. However, switching antifoam affects upstream fermentation productivity; downstream polishing DAF or coalescer on the broth side is the lower-risk path (Abuabdou et al. 2020).
What sustainable flux should I expect on a 0.1 μm PVDF MBR treating fully pretreated fermentation broth?
Expect 18–25 L/m²·h on submerged modules at MLSS 8–12 g/L and SRT 25–40 days, per the Springer 2023 MBR chapter and HydropureWater field data from antibiotic and enzyme plants (2025). Sidestream configurations typically run 10–15% higher flux but consume 2–3× the crossflow pumping energy.
What happens if DAF is skipped and broth feeds the MBR directly?
Skipping DAF delivers 8,000–15,000 mg/L TSS to the MBR, drives MLSS past 20 g/L, collapses F/M ratio, and forces CIP every 2–5 days. Membrane life typically drops to 12–24 months versus 4–7 years with DAF in the train (HydropureWater field data, 2025-09; Abuabdou et al. 2020).