What PP 22/2021 Says About Total Phosphorus Discharge
PP No. 22 Tahun 2021 Lampiran VI sets Indonesia's binding effluent quality standards and, as of 2026, remains the active regulation governing industrial wastewater discharge — it replaced PP 82/2001 in February 2021 and applies to every point source discharging to surface water, including the final IPAL outlet of textile, food, electronics, and metal-finishing plants. The Ministry of Environment and Forestry (KLHK) enforces the limits through the PROPER rating programme, direct site sampling, and quarterly self-reporting; a single exceedance can drop a plant from green to red and trigger administrative sanctions under PP 22/2021 Article 261-264. The regulation lists TP separately from nitrogen because phosphorus, not ammonia, is the limiting nutrient driving algal blooms and eutrophication in Indonesian inland waters such as the Citarum, Bengawan Solo, and Brantas corridors.
Legally, "total phosphorus" in PP 22/2021 Lampiran VI covers all chemical forms of P in the effluent: orthophosphate (PO4³⁻, HPO4²⁻, H2PO4⁻ depending on pH), polyphosphate from detergent and process additives, and organic-P from biological residues. The reported value is always expressed "as P" (mg P/L), not as phosphate ion, so a 1 mg/L TP limit means 1 mg of elemental phosphorus per litre — a common source of confusion when operators compare their lab report (often in mg/L PO4) against the regulation. Compliance is measured at the IPAL final outfall before mixing with receiving water, using either grab samples or 24-hour flow-weighted composites, and the analytical reference is SNI 06-6989.31-2005, which is methodologically equivalent to Standard Methods 4500-P. Operators who also struggle with pH excursions can cross-reference pH compliance under PP 22/2021 because phosphorus precipitation chemistry is tightly coupled to the 6.0–9.0 pH band required by the same Annex VI.
Sector-by-Sector TP Limits Under Annex VI
PP 22/2021 Lampiran VI publishes TP limits on a per-sector basis, and the spread is wide — from 0.05 mg/L for electronics to 10 mg/L for kraft pulp — so identifying the correct KBLI code is the first step before any retrofit decision. The most stringent limit in the regulation, 0.05 mg/L as P, applies to the electronics and metal-finishing/electroplating categories, where ultrapure rinse waters feed semiconductor and printed-circuit-board lines; meeting this band almost always requires tertiary chemical polishing followed by reverse osmosis, and most Indonesian PROPER green-rated plants in these sectors operate well below 0.1 mg/L to keep margin against analytical uncertainty. The 0.5 mg/L tier covers pharmaceutical and tannery discharges, while 1 mg/L applies to textile and laundry operations (KBLI 13120 and 96010), 2 mg/L to food and beverage (KBLI 10431/10510/10750), and 5 mg/L to integrated pulp and paper mills using the kraft process (KBLI 17012) without elemental chlorine bleaching. Above that, 10 mg/L is reserved for older kraft lines with biological treatment only.
The table below is built from PP 22/2021 Lampiran VI Tabel 1 and is the artifact most compliance engineers screenshot into their binder.
| Sector (KBLI reference) | TP limit (mg/L as P) | pH window (Annex VI) | Typical compliance band for PROPER green |
|---|---|---|---|
| Electronics / semiconductor (KBLI 26110–26120) | 0.05 | 6.0–9.0 | < 0.05 (RO polish required) |
| Metal finishing / electroplating (KBLI 25920) | 0.05–0.5 | 6.0–9.0 | 0.1–0.3 |
| Pharmaceutical (KBLI 21012) | 0.5 | 6.0–9.0 | 0.3–0.5 |
| Tannery / leather finishing (KBLI 15110) | 0.5 | 6.0–9.0 | 0.3–0.5 |
| Textile (KBLI 13120) | 1.0 | 6.0–9.0 | 0.5–1.0 |
| Laundry / dry cleaning (KBLI 96010) | 1.0 | 6.0–9.0 | 0.5–1.0 |
| Food & beverage (KBLI 10431/10510/10750) | 2.0 | 6.0–9.0 | 1.0–2.0 |
| Pulp & paper — kraft, no ECF (KBLI 17012) | 10 | 6.0–9.0 | 5–10 |
The 0.05 mg/L electronics limit is realistic only with RO; most Indonesian textile and food plants target the 1–2 mg/L band, which biological and chemical stages can reach without membrane polish. For plants that also need to track other metals, the heavy-metal limits under the same Annex VI use a parallel structure and are usually filed in the same quarterly LHK report.
How Total Phosphorus Is Measured in the Lab
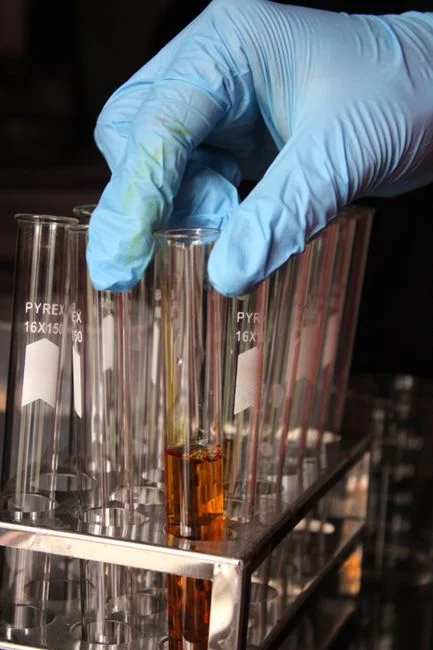
The regulated parameter is total phosphorus, not orthophosphate, and the distinction matters because the precipitation stage in a chemical plant removes PO4-P almost exclusively while leaving organic and polyphosphate fractions largely untouched. SNI 06-6989.31-2005 prescribes an acid-persulfate digestion at 120 °C for 30 minutes in an autoclave, which converts polyphosphate and organic-P to orthophosphate; the cooled digestate then reacts with ammonium molybdate and ascorbic acid to form a heteropoly blue complex measured spectrophotometrically at 880 nm. The method's detection limit is 0.01 mg/L as P and the linear working range extends to roughly 2 mg/L, which covers every PP 22/2021 compliance band including the 0.05 mg/L electronics limit when samples are concentrated by evaporation. PO4-P, by contrast, skips the digestion and is what most online colorimetric analyzers actually report — operators must add the digestion step (or run a separate TP channel) before comparing numbers against the regulation.
For plants above 50 m³/day, online TP analyzers using UV/persulfate digestion followed by either the molybdenum-blue or vanadomolybdate (yellow) method are now accepted for continuous PROPER self-monitoring, and KLHK inspectors routinely check analyzer calibration logs alongside quarterly lab cross-checks. Holding-time requirements are tight: samples for TP must be preserved with H2SO4 to pH < 2 and analysed within 28 days, while unpreserved PO4-P must be filtered and measured within 24 hours — a frequent audit finding when a plant's grab sample sits in a chiller over a long weekend. The Standard Methods 4500-P B-E procedure remains the international fallback and is what most SNI-accredited Indonesian laboratories (KAN-accredited) actually run.
Choosing the Right TP Removal Technology
Process selection follows the influent TP concentration, the target effluent band, and whether the site can tolerate chemical sludge. The table below maps typical Indonesian plant conditions to the cheapest process train that will hit the regulated number; for context, Indonesia's PROPER ratings for the 2024–2025 reporting period showed roughly 71% of participating factories in the blue-green tier (compliance baseline) and only about 6% in gold, with TP and COD as the two parameters most often dragging a site out of green.
| Influent TP (mg/L as P) | Recommended primary stage | Polishing stage (if needed) | Achievable effluent TP (mg/L as P) |
|---|---|---|---|
| 2–10 | Biological luxury uptake (A²/O or SBR with anaerobic/aerobic cycling) | Sand filter or MBR | 1.0–3.0 (Bio-P alone), 0.2–0.5 (with MBR polish) |
| 5–50 | Chemical precipitation with PAC or alum at 50–200 mg/L + rapid mix | Lamella settler or DAF | 0.5–2.0 |
| > 50 or target < 0.5 mg/L | Two-stage chemical precipitation (FeCl₃ + polymer) | DAF clarifier + MBR polishing stage; RO if < 0.1 mg/L is required | 0.2–0.5 (MBR), < 0.1 (RO) |
Biological luxury uptake alone rarely meets the 1 mg/L textile limit in tropical mixed wastewater because Indonesian effluent temperatures sit at 28–32 °C year-round, BOD:P ratios swing with each production batch, and side-stream polyphosphate from cleaning agents skips the Bio-P cycle — most working sites still dose an automatic PAC or alum dosing skid as a polish. Chemical precipitation with PAC at a typical 100–150 mg/L dose and a 1.5–2.0 stoichiometric ratio (moles Al per mole P) drives effluent to 0.5–2 mg/L and is the workhorse option for textile and food plants. The electronics and metal-finishing sectors, where the 0.05 mg/L limit applies, need a downstream MBR polishing stage or reverse osmosis, and most new fabs in Batam and Cikarang are built with RO in the train by default. As a benchmark for scale, the Norwegian municipal sector reported 1,269 tonnes TP/yr discharged from municipal plants in 2011 across 12 counties (Statistics Norway, Statistical Yearbook 2013 Table 44, retrieved 2013-11-02) — a useful reference for what a country-wide biological-plus-chemical programme actually removes in practice.
Step-by-Step Compliance Path for an Indonesian Plant
Step 1. Pull your KBLI code from the OSS system and look up the exact Annex VI row. A textile weaver (KBLI 13120) sits at 1 mg/L TP; a tofu and tempe plant (KBLI 10391) falls under food & beverage at 2 mg/L; a printed-circuit-board line (KBLI 26120) sits at 0.05 mg/L. The KBLI determines the number on the certificate, and the wrong code is the single most common cause of a PROPER downgrade in sector-mismatched audits.
Step 2. Run a 7-day composite sampling campaign at the IPAL outfall using an auto-sampler on a flow-proportional basis, then send splits to a KAN-accredited lab for SNI 06-6989.31-2005 TP and field-measured PO4-P. This baseline tells you whether the issue is genuine exceedance or a sampling artefact, and it provides the data package your consultant needs to size the retrofit.
Step 3. If TP exceeds the limit, dose PAC at 100–150 mg/L into a rapid-mix basin (G = 300–500 s⁻¹, 1–2 min) followed by flocculation (G = 30–80 s⁻¹, 15–20 min) and a DAF clarifier or high-efficiency lamella settler. Confirm pH stays inside the 6.0–9.0 PP 22/2021 band, since alum precipitation collapses below pH 6 and re-dissolves above pH 8.5.
Step 4. For sites discharging to a Class II or higher water body under PP 22/2021, or chasing PROPER gold, add an MBR polishing stage downstream of the chemical train, or specify RO if the site is electronics and the limit is 0.05 mg/L. Where water reuse is a board-level target — common in the Batu and Cikarang industrial estates — close the loop with a ZLD brine concentrator.
Step 5. File the quarterly LHK self-reporting form through SIMPEL, retain the dosing logs, calibration certificates, and lab chromatograms for at least 3 years per Permen LHK guidance, and schedule a confirmation TP grab during the next audit window. For CAPEX benchmarking against other Indonesian WTP builds, the Indonesian WTP CAPEX benchmarks piece breaks down typical 50–500 m³/day ranges by sector.
Frequently Asked Questions
What is the lowest TP discharge limit in Indonesia under PP 22/2021? The lowest limit is 0.05 mg/L as P, applied to the electronics and metal-finishing/electroplating sectors under Annex VI Tabel 1 (PP 22/2021).
Which SNI method is used to measure total phosphorus for PROPER reporting? PROPER reporting uses SNI 06-6989.31-2005, which is the acid-persulfate digestion followed by the ascorbic acid (molybdenum-blue) procedure, equivalent to Standard Methods 4500-P B-E.
What PAC dose is typical for chemical TP removal in a textile plant? Indonesian textile plants treating 5–15 mg/L influent TP typically dose PAC at 100–150 mg/L with a 1.5–2.0 Al:P molar ratio, achieving 0.5–2 mg/L effluent TP and 70–90% removal before the IPAL outfall.
Can biological phosphorus removal alone meet the 1 mg/L textile limit? Rarely in tropical mixed wastewater. Bio-P in an A²/O or SBR configuration typically delivers 1–3 mg/L effluent TP, so a chemical polish or MBR stage is normally required to hold the 1 mg/L Annex VI line consistently.
Does PO4-P equal TP for compliance purposes? No. PO4-P measures only the orthophosphate fraction, while the regulated parameter under PP 22/2021 is total phosphorus, which includes polyphosphate and organic-P after acid-persulfate digestion per SNI 06-6989.31-2005. Operators reporting only PO4-P systematically understate TP by 20–60%.