What Drives the Price of a Pharmaceutical Wastewater Treatment Plant in 2026
A pharmaceutical wastewater treatment plant in 2026 costs between $80,000 for a 5 m³/d packaged MBR skid and $6,000,000 for a 500 m³/d greenfield API facility with Fenton oxidation, MBR, and RO polishing. The dominant cost drivers are influent COD, antibiotic and solvent load, and the discharge target, not tank size. Secondary treatment (biological + MBR) accounts for 40–55% of CAPEX; advanced oxidation and RO add another 25–35%.
Four levers explain roughly 80% of the price spread you will see between vendor quotes. Flow (m³/d) sets the baseline hydraulic capacity, but it is a weaker predictor than most procurement specs assume. Influent COD matters more: synthesis APIs typically run 1,500–8,000 mg/L, while formulation and blending lines often sit below 800 mg/L, and a plant sized for 6,000 mg/L will carry 2–3× the biological reactor volume of the same flow at 2,000 mg/L. Antibiotic and solvent load dictates whether Fenton or ozone is mandatory, because biological units alone deliver only 62.0–78.3% tetracycline removal in full-scale northern-China PWWTPs (per a 2015 Springer field study, the highest-quality reference for biological removal ceilings). Discharge target — sewer to a CETP, surface water, or reuse/ZLD — is the single largest swing factor, because each tier adds a unit operation.
Process intensification is the reason "tank size" is a poor price proxy. A 100 m³/d synthesis plant with MBR + Fenton + RO at 2,500 mg/L COD lands near $2.1M; the same flow at 800 mg/L formulation effluent without advanced oxidation lands near $0.9M. The capacity split — roughly 20% pretreatment / 50% biological / 30% advanced — is more consistent across projects than the tank volume itself. Saccharin and ammoniacal nitrogen, flagged as routine quality markers in a 2024 Springer characterization of real Indian pharma effluent, are the early-warning parameters that tell you advanced treatment is non-negotiable before the lab work is even complete.
Pharma Influent Types and the Process Train Each One Demands
Pharma wastewater is not one effluent. Four archetypes drive 90% of the process-train decisions a buyer will face in 2026, and each one maps to a different equipment list and cost band. Getting the archetype right is the difference between a defensible CAPEX number and a quote that doubles during engineering.
Chemical synthesis APIs carry the highest load: COD 1,500–8,000 mg/L, residual solvents (methanol, acetone, DCM traces), recalcitrant active compounds, and often high salinity. The standard train is equalization → Fenton or ozone → biological (MBR or SBR) → RO polish, with CAPEX split roughly 20% pretreatment / 50% biological / 30% advanced. Fermentation effluents (antibiotics, vitamins, enzymes) have high BOD (4,000–15,000 mg/L), suspended mycelia, and strong color. The high BOD is an asset, not a problem: primary clarification → anaerobic (UASB or EGSB) → aerobic MBR → disinfection converts the load into biogas that can offset 20–35% of aeration power. Formulation and blending lines (tablets, syrups, creams) typically run below 800 mg/L COD with intermittent cleaning-agent spikes. A DAF → biological → chlorination or ClO₂ train is sufficient; CAPEX lands near 40% of a synthesis plant at the same flow. Biotech facilities (vaccines, mAbs, cell culture) produce variable flows with elevated ammonia and proteins, often best handled with a nitrification/denitrification MBR plus nutrient removal.
| Influent archetype | Typical COD (mg/L) | Recommended train | Cost multiplier vs formulation baseline |
|---|---|---|---|
| Chemical synthesis APIs | 1,500–8,000 | EQ → Fenton/O₃ → MBR → RO | 2.2–2.8× |
| Fermentation (antibiotics, vitamins) | 4,000–15,000 | Primary clarifier → UASB/EGSB → MBR → disinfection | 1.6–2.0× |
| Formulation / blending | <800 | DAF → biological → ClO₂ | 1.0× (baseline) |
| Biotech (vaccines, mAbs) | 800–3,000 + high NH₃-N | EQ → MBR (nitrification/denitrification) → UF | 1.4–1.7× |
The multipliers are derived from HydropureWater field data across 2024–2026 commissioning projects. They will not match any single vendor quote exactly, but they will catch a quote that is off by 50% or more — which is the failure mode that delays pharma EPC schedules.
2026 CAPEX Breakdown: What You Are Actually Paying For
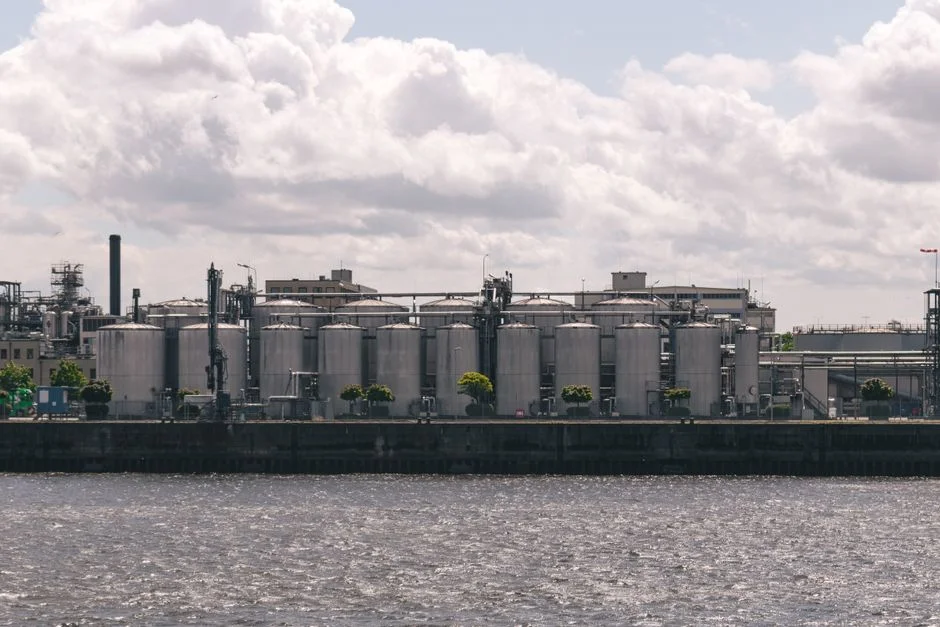
CAPEX for a greenfield pharmaceutical wastewater treatment plant splits into six line items, and the biological reactor + MBR block is always the single largest. Buyers who benchmark only against a lump-sum number miss the line items that vendors most often under-scope — automation and civil work are the two that bite hardest during execution.
Civil work and tanks run 15–25% of CAPEX for a greenfield plant, dropping to 5–10% for a packaged or skid-mounted plant. The MBR membrane bioreactor block — basin + aeration + PVDF membrane cassettes + permeate pumps — runs 40–55%, with flat-sheet PVDF at $80–$140/m² and hollow-fiber at $50–$90/m² from top brands in 2026. Advanced oxidation (Fenton or ozone) adds 15–20%, driven almost entirely by H₂O₂ dose, which scales with recalcitrant COD load rather than flow. Scrubber and off-gas treatment for the Fenton reactor's acid gases is often forgotten at budget stage and adds 2–4% if HCl scrubbing is required. RO or ZLD polishing contributes 10–20%, but only when reuse or zero-liquid-discharge is in the spec. Automation, instrumentation, and SCADA run 5–10% — and this is the line item most under-scoped by first-time pharma WWTP buyers; a 200 m³/d plant with proper SCADA, redundant instruments, and 21 CFR Part 11-style data logging is a different budget number than a plant with a relay panel and a local HMI.
| Line item | % of CAPEX (greenfield) | % of CAPEX (packaged/skid) | Worked $2.4M example (100 m³/d synthesis API, MBR + Fenton + RO) |
|---|---|---|---|
| Civil works & tanks | 15–25% | 5–10% | $420,000 |
| Biological reactor + MBR membranes | 40–55% | 50–60% | $1,080,000 |
| Advanced oxidation (Fenton or O₃) | 15–20% | 15–20% | $420,000 |
| RO / ZLD polishing | 10–20% | 10–15% | $310,000 |
| Automation, instrumentation, SCADA | 5–10% | 8–12% | $170,000 |
The $2.4M worked example assumes influent COD 4,500 mg/L, discharge to surface water, MBR effluent ≤50 mg/L COD, and 70% water reuse via RO. Vendors quoting under $1.8M for the same spec are typically leaving out the RO block, the civil scope, or the instrumentation package — all of which will reappear as change orders.
OPEX Drivers: Energy, Chemicals, Sludge, and Membrane Replacement
Sticker price is half the story. OPEX for a 2026 pharma WWTP runs $1.80–$4.50 per m³ treated depending on train complexity, and a buyer who underestimates OPEX by 30% will see a CFO reject the project at the gate-stage review.
Energy is the largest OPEX line at 30–45% of the total, and aeration inside the MBR basin is the biggest sub-line. MBR-dominant trains run 0.8–2.5 kWh/m³, while SBR trains run 0.6–1.8 kWh/m³ and Fenton+biological trains run 1.0–2.2 kWh/m³. At Indian industrial tariffs of $0.08–$0.11/kWh, that is $0.10–$0.25/m³ for power alone. Chemicals for Fenton (H₂O₂ 50% + FeSO₄) run $0.15–$0.40 per m³ treated, depending on the recalcitrant COD dose; NaOH for the post-Fenton pH swing adds another $0.05–$0.12. A PLC-controlled chemical dosing skid typically pays back in 9–14 months by cutting H₂O₂ over-dose, which is the single most common OPEX leak in Fenton trains.
Membrane replacement is the predictable surprise. PVDF flat-sheet MBR carries an 8–12 year service life in pharma service; hollow fiber is 5–7 years. Amortized over treated volume, that is $0.02–$0.06/m³ for flat-sheet and $0.04–$0.09/m³ for hollow fiber. Sludge handling is the line item that flips a budget from "manageable" to "painful": pharma sludge is often classified hazardous, and a plate-and-frame sludge filter press dewatering to 22–28% dry solids is the baseline. Dewatered cake disposal runs $80–$220/tonne in 2026, with the high end reflecting incineration rather than secure landfill.
| OPEX line | Typical range ($/m³ treated) | % of OPEX | Controllable by? |
|---|---|---|---|
| Energy (aeration + pumps) | $0.20–$0.55 | 30–45% | Blower VFD, MBR flux setpoint |
| Chemicals (Fenton, NaOH, ClO₂) | $0.20–$0.55 | 15–25% | Dosing automation, dose tuning |
| Membrane replacement (amortized) | $0.02–$0.09 | 3–6% | Membrane type, CIP discipline |
| Sludge dewatering + disposal | $0.25–$0.70 | 20–30% | Dewatering DS target, waste class |
| Labor + maintenance | $0.15–$0.45 | 10–20% | Plant automation level |
| Total OPEX (2026) | $1.80–$4.50 | 100% | — |
The wide range is real, not vendor hedging. A 50 m³/d formulation plant running DAF + SBR + ClO₂ lands near $1.80/m³; a 500 m³/d synthesis plant with MBR + Fenton + RO lands near $4.20/m³. The difference is process complexity, not operator inefficiency.
Process Comparison: MBR vs SBR vs Fenton+Biological vs RO/ZLD
Process selection is where most procurement errors start. The four trains that cover 95% of pharma WWTP builds in 2026 — MBR, SBR, Fenton + biological, and RO/ZLD polish — each have a defensible use case and a defensible reason to avoid them. The numbers below are normalized per m³/d of treatment capacity and per m³ of treated effluent, so a 200 m³/d plant with MBR + Fenton lands at roughly $2.1M CAPEX and $2.95/m³ OPEX.
MBR is the default for synthesis APIs and biotech: CAPEX $1,200–$2,200 per m³/d, OPEX $2.20–$3.50/m³, smallest footprint, effluent COD ≤50 mg/L, antibiotic removal 60–78% (per the 2015 Springer full-scale study). A modular MBR skid is the right answer for any flow under 200 m³/d where footprint is constrained. SBR is cheaper on CAPEX ($900–$1,500 per m³/d) and OPEX ($1.80–$2.80/m³), but needs 30–50% more footprint and caps antibiotic removal 10–15 percentage points below MBR — acceptable for formulation, marginal for synthesis. Fenton + biological adds $120–$280 per m³/d to CAPEX but lifts recalcitrant antibiotic removal to 85–95%, which is mandatory for EU BAT-AEL compliance and for any plant discharging under China GB 21904-2008; the DF series flat-sheet MBR membrane pair well with a Fenton front-end because PVDF tolerates the residual H₂O₂ better than most polymeric membranes. RO / ZLD adds $600–$1,200 per m³/d and is only justified when water reuse ≥70% or when the site is inland with zero discharge enforced; an industrial RO polish downstream of MBR is the standard configuration.
| Process train | CAPEX ($/m³/d) | OPEX ($/m³) | Footprint (m² per m³/d) | Effluent COD (mg/L) | Antibiotic removal | Best fit |
|---|---|---|---|---|---|---|
| MBR (standalone) | 1,200–2,200 | 2.20–3.50 | 0.3–0.6 | ≤50 | 60–78% | Synthesis APIs, biotech, tight sites |
| SBR (standalone) | 900–1,500 | 1.80–2.80 | 0.5–1.0 | ≤80 | 50–65% | Formulation, low-COD, ample land |
| Fenton + biological | +120–280 vs baseline | +0.30–0.60 vs baseline | +0.1–0.2 | ≤120 → ≤40 with MBR | 85–95% | EU/CN discharge, recalcitrant APIs |
| RO / ZLD (polish) | +600–1,200 | +0.40–0.90 | +0.1–0.2 | ≤10 | ≥99% | Reuse ≥70%, inland ZLD sites |
The OPEX premiums for Fenton and RO are additive, not nested — a full MBR + Fenton + RO plant runs roughly $3.80–$4.50/m³, which is the top of the OPEX band and the right reference number for a 500 m³/d greenfield API project.
Compliance Anchors: EPA, EU, and China Discharge Limits That Set the Spec
Process selection is downstream of compliance. The three regulatory benchmarks that drive most 2026 pharma WWTP specs are EPA 40 CFR 439, the EU Common Waste Water and Waste Gas Treatment/Management Systems BREF (2016), and China GB 21904-2008. Each one sets a different COD/ammonia target, and each one pushes the process train in a different direction.
EPA 40 CFR 439 sets categorical standards for pharmaceutical manufacturing: COD 354 mg/L daily maximum, TSS 66 mg/L daily maximum for existing sources discharging directly to surface water. These limits are reachable with a well-operated MBR alone, which is why biological + MBR is the floor for any US sited plant. The EU BAT-AEL under the CWW BREF tightens COD to <100 mg/L as the associated emission level, which is what forces Fenton or ozone ahead of the biological step for synthesis APIs in EU jurisdictions. China GB 21904-2008 sets COD ≤120 mg/L and ammoniacal nitrogen ≤25 mg/L for synthesis API effluent — this is the spec most Asian EPC quotes are sized to, and it is also the spec that makes Fenton + MBR the de facto baseline rather than an upgrade. Antibiotic residues are not yet numerically capped in most jurisdictions, but EU watchlists and the draft revisions to GB 21904 are already pushing the industry toward advanced oxidation regardless.
| Standard | COD limit (mg/L) | BOD₅ (mg/L) | NH₃-N (mg/L) | TSS (mg/L) | Process implication |
|---|---|---|---|---|---|
| EPA 40 CFR 439 (existing sources, direct discharge) | 354 (daily max) | — | — | 66 (daily max) | MBR alone is sufficient |
| EU BAT-AEL (CWW BREF, 2016) | <100 | <20 | — | <35 | Fenton/O₃ + MBR mandatory for synthesis |
| China GB 21904-2008 (synthesis API) | ≤120 | ≤25 | ≤25 | ≤50 | Fenton + MBR is the baseline |
For Pakistan sited plants discharging to inland receiving waters, the parallel reference is the NEQS pharma effluent limits, which align closer to the EU envelope than to the EPA floor.
3-Year Payback Worked Example: Indian Generic-API Plant, 200 m³/d
Payback is where the project either survives the CFO review or does not. The worked example below uses 2026 Indian tariff and disposal costs; a buyer in a different country should re-cost the OPEX and disposal line but the CAPEX scales linearly with flow for synthesis APIs.
Site: 200 m³/d synthesis API plant, influent COD 4,500 mg/L, sewer discharge to a CETP with a pretreatment compliance spec at COD ≤1,000 mg/L. Process train: equalization → Fenton → MBR → RO polish, sized for 70% water reuse. CAPEX lands at $2.1M (per the 100 m³/d example scaled by 2× with a 10% scale discount). OPEX at $2.95/m³ × 200 m³/d × 330 operating days = $194,700/yr, plus RO membrane amortized at $0.05/m³ × 66,000 m³/yr = $3,300/yr, giving total OPEX near $215,000/yr. Savings versus the alternative — offsite tanker disposal at $18–$32/m³ in India 2026 (HydropureWater field data) — are $1.19M–$2.11M/yr at 200 m³/d × 330 days. Net annual benefit is $975K–$1.90M after OPEX, and simple payback lands at 1.1–2.2 years, well inside the 3-year hurdle most Indian pharma CFOs apply. A 5-year NPV at 12% discount rate stays positive across the full $18–$32/m³ tanker range. For a buyer who wants to extend the model to solvent-heavy lines, the advanced oxidation cost model for solvent-laden effluent provides the parameter set; for ongoing O&M cost control, the pharma WWTP maintenance protocol covers the membrane CIP and Fenton dose-tuning discipline that keeps OPEX inside the modeled band.
Frequently Asked Questions
What does a 5 m³/d pharmaceutical wastewater treatment plant cost in 2026?
A packaged MBR skid rated at 5 m³/d with a DAF pre-clarifier and ClO2 disinfection lands at $80,000–$120,000 in 2026. Add Fenton oxidation ($25,000–$40,000) if the influent is synthesis API rather than formulation.
What is the realistic antibiotic removal ceiling for biological treatment alone?
Full-scale biological PWWTPs in northern China achieved 62.0–78.3% tetracycline removal in a 2015 Springer study; sorption to sludge contributed 12.6–33.5%, biodegradation the rest. Fenton or ozone is required to push above 85%.
When should I choose SBR instead of MBR for a pharma WWTP?
SBR wins on CAPEX ($900–$1,500 per m³/d vs $1,200–$2,200 for MBR) and is the right pick for formulation lines with COD under 800 mg/L and ample land. MBR wins on footprint, antibiotic removal, and effluent stability.
How do EU and China discharge specs differ for pharma effluent?
EU BAT-AEL targets COD <100 mg/L and pushes synthesis plants to Fenton + MBR. China GB 21904-2008 sets COD ≤120 mg/L and NH₃-N ≤25 mg/L — operationally similar, but GB 21904 enforces ammoniacal nitrogen more strictly than the EU CWW BREF.
What does pharma sludge disposal cost in 2026?
Dewatered cake from a plate-and-frame filter press at 22–28% DS runs $80–$220/tonne for disposal, with the high end reflecting hazardous-waste incineration rather than secure landfill.