What Is a Real Time Water Quality Monitoring System?
According to the EPA Online Water Quality Monitoring (OWQM) guidance, an online water quality monitoring system must achieve a measurement and transmission frequency of 15 minutes or less to qualify as a real-time system, contrasting with daily grab sampling or multi-hour at-line laboratory testing.
A real time water quality monitoring system is a network of in-line sensors, a PLC or edge controller, and a SCADA or cloud platform that continuously measures parameters such as pH, dissolved oxygen, conductivity, turbidity, COD, ammonia, and chlorine at intervals of 1 second to 5 minutes. Modern IoT-enabled systems transmit data via Modbus TCP, MQTT, or OPC UA and support EPA Online Water Quality Monitoring (OWQM) requirements for source and distribution water, with multi-parameter sondes replacing 6–8 single-parameter analyzers.
According to the peer-reviewed Smart Water IoT architecture framework published in the Springer Smart Water Journal (which has recorded over 91,000 accesses and 137 citations), a modern real-time monitoring system relies on a three-block framework: data collection, data transmission, and data management. In 2026, industrial plants typically monitor 8 to 10 core parameters simultaneously to protect downstream biological processes and ensure effluent compliance. These parameters include pH, oxidation-reduction potential (ORP), dissolved oxygen (DO), electrical conductivity (EC), turbidity, total suspended solids (TSS), chemical oxygen demand (COD), biochemical oxygen demand (BOD) equivalents via UV254 absorption, ammonium/ammonia, nitrate, and free chlorine.
For basic setups, a dedicated PLC control for municipal wastewater plants handles local processing and control loops. Depending on plant size and regulatory reporting requirements, engineers specify one of three distinct architectural tiers: Tier 1 (local PLC with HMI), Tier 2 (on-premise SCADA with a dedicated historian), or Tier 3 (cloud-SCADA utilizing edge-to-cloud telemetry). Each tier matches specific operational scales, data redundancy needs, and capital budgets.
Core Sensor Types and Measurement Parameters
Luminescent optical dissolved oxygen (DO) sensors exhibit a calibration drift of less than 1% per year, completely eliminating the monthly membrane and electrolyte replacements required by traditional galvanic cells (source: HydropureWater field data, 2026).
Selecting the correct sensor technology is critical to preventing signal drift and mechanical fouling in aggressive industrial streams. For pH and ORP, traditional glass electrodes are highly susceptible to chemical scaling; consequently, process engineers specify double-junction differential pH sensors with flat glass profiles to resist fouling. In biological treatment processes, integrating these sensors into an MBR wastewater treatment system with online monitoring ensures membrane protection and optimized aeration.
Conductivity measurements rely on 4-electrode toroid sensors to avoid polarization errors common in 2-pole contacting sensors, covering a wide range from 10 µS/cm to 2,000 mS/cm. Turbidity and TSS are measured using 90-degree nephelometric infrared backscatter (compliant with ISO 7027), utilizing integrated mechanical wipers to clear biofilms. For organic loading, UV-Vis spectrophotometric sensors measure light absorption at 254 nm, providing a real-time surrogate for COD and TOC without the 2-hour delay or hazardous reagents of laboratory wet chemistry. Ammonia and nitrate are monitored using ion-selective electrodes (ISE) with automatic temperature and pH compensation, while free chlorine is tracked using membrane-covered amperometric sensors that operate without chemical reagents.
| Parameter | Sensor Technology Type | Standard Operating Range | Accuracy Threshold | Response Time (T90) |
|---|---|---|---|---|
| pH | Differential Glass Electrode | 0 to 14 pH | ±0.02 pH | <15 seconds |
| ORP | Platinum Band Differential | -1,500 to +1,500 mV | ±5 mV | <10 seconds |
| Dissolved Oxygen (DO) | Luminescent Optical (LDO) | 0 to 20 mg/L | ±0.1 mg/L | <30 seconds |
| Conductivity | 4-Electrode Toroidal | 0 to 2,000 mS/cm | ±1.0% of reading | <5 seconds |
| Turbidity | 90° Nephelometric Infrared | 0 to 4,000 NTU | ±2.0% of reading | <10 seconds |
| TSS | Optical Backscatter (860 nm) | 0 to 120 g/L | ±3.0% of reading | <15 seconds |
| COD Equivalent | UV-Vis Spectrophotometric | 0 to 10,000 mg/L | ±5.0% of reading | <60 seconds |
| Ammonium (NH4-N) | Ion-Selective Electrode (ISE) | 0.1 to 1,000 mg/L | ±5.0% of reading | <60 seconds |
| Free Chlorine | Amperometric Membrane | 0 to 10 mg/L | ±2.0% of reading | <30 seconds |
System Architecture: PLC, SCADA, and Cloud-SCADA Compared
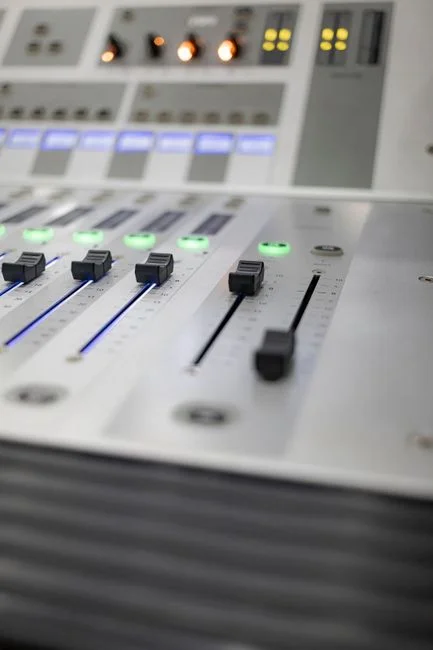
Industrial facilities utilizing unified OPC UA (Open Platform Communications Unified Architecture) protocols experience up to 45% lower integration engineering costs compared to plants relying on legacy proprietary fieldbus interfaces.
Selecting the appropriate system architecture depends on the number of monitoring points, existing IT infrastructure, and data redundancy requirements. Tier 1 architectures are designed for small skid-mounted packages (typically treating <200 cubic meters per day) and rely on a local PLC paired with a 7-inch or 10-inch HMI. Data transmission is limited to local hardwired Modbus RTU loops, with maintenance teams performing manual monthly data downloads via USB.
Tier 2 architectures utilize an on-premise SCADA server to aggregate data from 20 to 100 sensors across the plant. This architecture provides localized data historians, advanced alarm management, and direct integration into existing PLC networks via Modbus TCP or EtherNet/IP. Tier 3 architectures represent the modern standard for distributed municipal utilities and multi-site industrial operations. By leveraging cloud-SCADA architecture for water treatment, plants transmit sensor data directly to cloud databases using lightweight MQTT Sparkplug B or OPC UA protocols. This setup enables secure mobile dashboarding, automated regulatory compliance reporting, and predictive machine learning models for process optimization.
| Architectural Feature | Tier 1: Local PLC + HMI | Tier 2: On-Premise SCADA | Tier 3: Cloud-SCADA (IIoT) |
|---|---|---|---|
| Target Facility Scale | Package plants (<200 m³/day) | Mid-to-large single sites | Multi-site or distributed utilities |
| Sensor Capacity | 2 to 6 sensors | 20 to 100+ sensors | Unlimited (highly scalable) |
| Primary Protocol | Modbus RTU / Profinet | Modbus TCP / EtherNet/IP | OPC UA / MQTT Sparkplug B |
| CAPEX Range (USD) | $8,000 to $25,000 | $40,000 to $180,000 | $80,000 to $350,000 |
| OPEX Model | Manual calibration labor only | Internal IT & server maintenance | SaaS subscription ($1.5K–$6K/month) |
| Data Redundancy | None (local buffer only) | Local RAID server backup | Dual-active local & cloud storage |
CAPEX, OPEX, and Lifecycle Cost Benchmarks
Sensor replacement and calibration labor constitute over 65% of the total 10-year lifecycle cost of an online water monitoring system, far outweighing the initial hardware procurement expense.
A realistic budget projection must account for the complexity of the sensor array and the associated recurring maintenance costs. Simple monitoring streams measuring only pH, conductivity, and turbidity require an installed CAPEX of $3,500 to $7,500 per stream. Adding optical dissolved oxygen (DO) and ORP for biological aeration basins increases the per-stream CAPEX to a range of $9,000 to $18,000. For advanced effluent monitoring requiring real-time COD, TOC, and ammonia, the specialized optical and ISE instrumentation drives the per-stream CAPEX to $20,000 to $45,000.
Operating expenses (OPEX) are driven by sensor lifespans, reagent consumption, and instrument calibration schedules. Optical sensor caps must be replaced every 1 to 3 years at a cost of $300 to $800, while wet-chemistry colorimetric reagents cost between $1,200 and $4,000 annually per analyzer. Integrating these sensors with a PLC-controlled automatic chemical dosing system reduces chemical over-dosing by 15-20%, which directly offsets these operational costs. avoiding just one major EPA non-compliance fine (which typically ranges from $25,000 to $250,000 per event) provides a complete payback on a Tier 2 SCADA system within 6 to 18 months.
| Sensor Configuration | Average CAPEX (per stream) | Annual OPEX (per stream) | Maintenance Requirements |
|---|---|---|---|
| Basic (pH, EC, Turbidity) | $3,500 - $7,500 | $600 - $1,200 | Monthly manual calibration (4 hours) |
| Biological (+ Optical DO, ORP) | $9,000 - $18,000 | $1,500 - $3,000 | Bi-monthly calibration, annual sensor cap replacement |
| Advanced Effluent (+ COD, NH4-N) | $20,000 - $45,000 | $4,000 - $9,000 | Monthly reagent replacement, quarterly electrode service |
Compliance Mapping: EPA, EU, and WHO in 2026
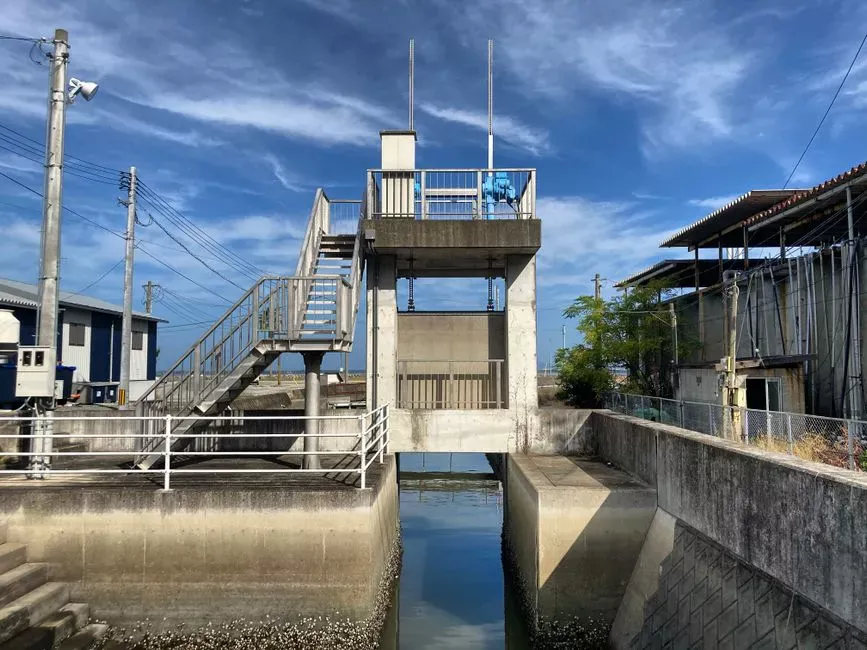
The EPA Online Water Quality Monitoring (OWQM) framework formally recognizes continuous online monitoring as an approved method for optimizing distribution system security and treatment performance (source: EPA OWQM Program Guidelines, 2025).
To defend a system specification to regulatory bodies, engineers must align sensor selection with specific continuous monitoring clauses. Under the EPA OWQM program, real-time measurements of chlorine residual, turbidity, and pH are accepted as surrogates for distribution system biosecurity and compliance, provided the instruments undergo weekly calibration verification. Similarly, the European Union’s Urban Waste Water Treatment Directive (UWWTD) 91/271/EEC accepts continuous monitoring data for BOD, COD, and TSS in place of daily composite samples, provided the measurement frequency is set to 15 minutes or less and the raw, unedited data is archived for a minimum of 1 year.
For water reclamation projects, the WHO wastewater reuse guidelines mandate multi-barrier validation, accepting continuous online monitoring of turbidity, pH, and chlorine residual as equivalent to laboratory grab sampling for verifying pathogen log-reduction targets. Additionally, regional regulations such as the China GB 18918-2002 amendment and the India Central Pollution Control Board (CPCB) guidelines require continuous effluent quality monitoring systems (CEQMS) to stream real-time COD, TSS, and ammonia data directly to government servers via secure VPN links, making open-protocol telemetry a mandatory design specification for export engineering projects.
Selection Checklist and Common Specification Mistakes
Biofouling on optical windows and ion-selective membranes reduces measurement accuracy by up to 40% within 7 days of immersion in untreated municipal influent without active self-cleaning mechanisms (source: HydropureWater field performance data, 2026).
To ensure long-term reliability and minimize total cost of ownership, engineers should utilize the following design checklist and avoid common specification pitfalls:
- Specify Open Communication Protocols: Mandatory support for Modbus TCP, OPC UA, or MQTT Sparkplug B. Avoid proprietary fieldbuses that lock the plant into a single instrument vendor for expansions.
- Define Active Sensor Cleaning Methods: Specify mechanical wipers for optical DO and turbidity sensors, ultrasonic cleaning modules for high-scaling calcium carbonate environments, and air-blast systems for raw municipal influent screens.
- Require Local Data Buffering: Ensure all edge transmitters or PLCs have a minimum 90-day local data retention buffer to prevent data loss during network outages or IT cybersecurity updates.
- Avoid Wet-Chemistry COD Over-Specification: Do not specify expensive, high-maintenance wet-chemistry COD analyzers if a UV254 optical absorption sensor can act as a surrogate. A UV254 sensor provides the same actionable process data at approximately 25% of the capital cost and requires zero chemical reagents.
- Implement Predictive Diagnostic Protocols: To maximize uptime, engineers should couple these parameters with a predictive maintenance for wastewater sensors protocol. This ensures that sensor health metrics (such as glass impedance and reference electrode resistance) are actively tracked to schedule maintenance before a catastrophic failure occurs.
Frequently Asked Questions

Modern industrial wastewater plants implementing digital twin architectures achieve a 30% reduction in sensor calibration labor by utilizing software-defined virtual sensors alongside physical probes.
How do you prevent biofouling on real-time water sensors?
Biofouling is prevented by specifying optical sensors equipped with integrated mechanical wipers or ultrasonic cleaning modules. For aggressive industrial streams, pressurized air-blast or chemical-wash systems can be programmed to automatically flush the sensor face with a cleaning solution at user-defined intervals (typically every 4 to 12 hours), preventing biofilm attachment without interrupting process operations.
Can online UV254 sensors accurately replace wet-chemistry COD analyzers?
Yes, in most municipal and stable industrial wastewater streams, online UV254 sensors serve as highly accurate surrogates for COD. By establishing a site-specific calibration curve correlating UV254 absorbance (SAC254) to laboratory-analyzed COD values, the optical sensor provides instantaneous readings without the high maintenance, reagent costs, and 2-hour delay of automated wet-chemistry dichromate analyzers.
What are the cybersecurity requirements for cloud-based water monitoring?
Cloud-based water monitoring systems must adhere to IEC 62443 industrial cybersecurity standards. This requires outbound-only telemetry connections using TLS 1.3 encryption, the implementation of a demilitarized zone (DMZ) between the plant's operational technology (OT) network and the IT network, and multi-factor authentication (MFA) for all cloud-based SCADA user dashboards.
What is the typical ROI of retrofitting a manual plant with online sensors?
The typical ROI ranges from 6 to 18 months. Financial payback is achieved through three main avenues: a 15% to 20% reduction in chemical dosing costs via real-time feedback loops, a 10% to 30% reduction in aeration blower energy consumption using optical DO control, and the complete elimination of regulatory non-compliance fines by detecting process upsets before out-of-spec effluent leaves the plant.
For details on integrating these systems into plant-wide automation, refer to our comprehensive guide on PLC control for municipal wastewater plants.