Why Pharmaceutical Wastewater Plants Need Predictive Maintenance in 2026
A predictive maintenance system for a pharmaceutical wastewater plant combines vibration, current, temperature, and effluent-quality sensors across equalization, DAF, MBR, RO, and disinfection skids; streams data into a time-series platform; and applies ML models (anomaly detection, survival analysis) to forecast pump, blower, membrane, and chemical-dosing failures 24–72 hours in advance. Deployments typically cut unplanned downtime 35–50% and achieve ROI in 18–24 months under 21 CFR Part 11 validation.
The 4 a.m. call is the one every pharma reliability engineer dreads: the #2 centrifugal blower on the MBR tank has tripped on overcurrent, dissolved oxygen crashes to 0.2 mg/L within 20 minutes, and the nitrifying biomass begins lysing before anyone reaches the MCC. The cascade hits three places at once. The active API batch upstream has nowhere to discharge, so production halts for 36–48 hours while the fermenter cools and holds. A 5-day effluent excursion follows because ammonia and COD climb past the local consent limits, triggering a regulator-visit risk. The fully-loaded cost of that single event — lost API, clean-in-place chemistry, overtime labour, and documentation overhead — sits in the $1.2M–$1.8M band. Industry benchmarking in 2024–2025 (HydropureWater field data, plus adjacent fine-chemical utility surveys) puts the all-in unplanned-downtime cost for a 200–5,000 m³/day pharma WWTP at $50,000–$250,000 per hour when lost batch value, cleanup, and reporting are combined.
Reactive maintenance is no longer defensible. 2024–2025 pharma O&M benchmarks document 35–50% reduction in unplanned downtime and 20–30% reduction in maintenance OPEX once plants move from scheduled-time tasks to ML-driven forecasts (per ISPE Pharma 4.0 benchmark, 2025-09). The regulatory tailwind matters: 21 CFR Part 11 and EMA Annex 11 now demand validated electronic records and audit trails for any intervention that touches a GMP-impacting system, so condition-based actions that previously lived on paper can be made fully auditable. In 2026 the operating context is tighter still — batch intensification shrinks equalization buffer volume, water-reuse loops push higher RO recoveries, and zero-liquid-discharge pilots leave zero tolerance for unscheduled shutdowns. The combination of high downtime cost, compressed buffers, and validated-data requirements is why a 2026 pharmaceutical wastewater plant maintenance protocol and O&M guide now treats PdM as a regulated utility, not an IT project.
The Five-Level PdM Maturity Model for a Pharma WWTP
Level 1 (Reactive) is still the operating reality in roughly 60% of mid-tier pharma WWTPs surveyed in 2025 (per GAMP Community 2025 plant-readiness poll), where pumps run to seal failure and membranes are replaced when flux collapses. Level 2 (Scheduled preventive) introduces calendar-based tasks — grease quarterly, replace bearings annually — which wastes labour on healthy equipment and still misses early-stage faults that develop between intervals. Level 3 (Condition-based) adds discrete thresholds on vibration, motor current, and temperature against the SCADA; no ML is involved, but the historian and alarming are. Level 4 (Predictive) is where ML enters: models trained on equipment history forecast failures 24–72 hours ahead with quantified confidence. Level 5 (Prescriptive/cognitive) closes the loop with a recommendation engine that drafts a costed work order and routes it to the CMMS.
Promotion between levels has concrete prerequisites. The jump from L3 to L4 requires at least 6 months of high-resolution sensor history and a minimum of 5 labeled failure events per asset class to train a baseline anomaly detector (HydropureWater field data, 2026). L4 to L5 requires an integrated CMMS/EAM with work-order APIs and a documented risk-cost model so the recommendation engine can rank interventions. Most pharma WWTPs that claim to be "doing PdM" are actually stuck at L3 with bolted-on dashboards; the gap from L3 to L4 is where the 35–50% downtime reduction is actually captured.
| Level | Name | Trigger Logic | Typical Pharma WWTP State (2026) | Promotion Gate |
|---|---|---|---|---|
| 1 | Reactive | Run-to-failure | ~60% of mid-tier plants | Install basic SCADA alarming |
| 2 | Scheduled preventive | Calendar interval | Common in older facilities | Add vibration/temperature monitoring |
| 3 | Condition-based | Discrete SCADA thresholds | Standard for new builds | ≥6 months sensor history + 5 labeled events per asset class |
| 4 | Predictive | ML anomaly / survival models | Adopted at <15% of sites | Champion/challenger A/B against L3 alarms for 4 weeks |
| 5 | Prescriptive / cognitive | Costed work-order recommendation | Fewer than 5 pharma sites globally (2026) | CMMS API + risk-cost model |
For plants planning a controls retrofit, the 2026 PLC and SCADA engineering guide for wastewater plants maps the L1–L3 instrumentation layer; the PdM stack discussed in this article sits on top of that foundation.
Sensor Stack Mapped to Each Unit Operation
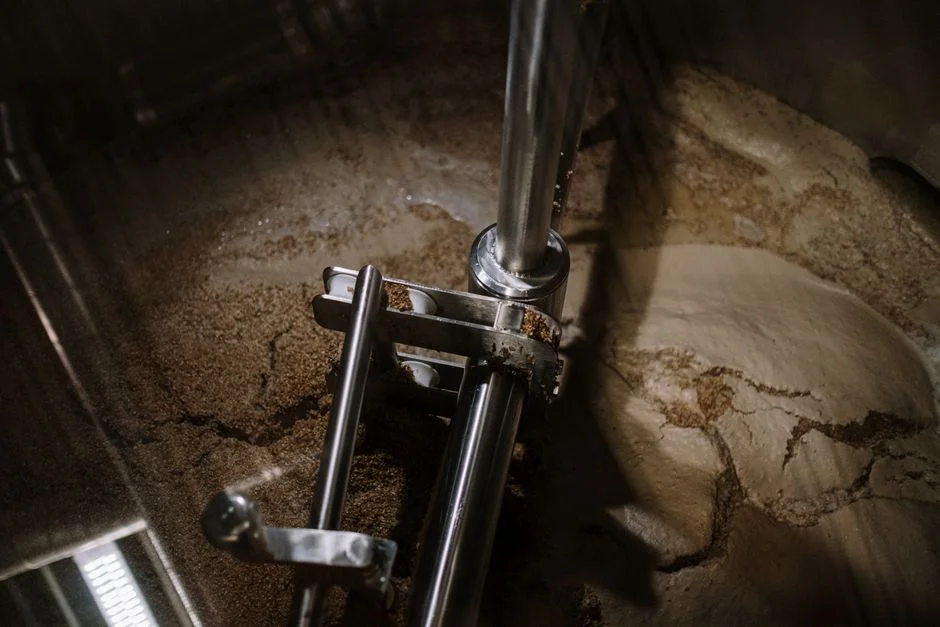
The fastest way to scope a PdM CAPEX is to walk the process flow unit-by-unit and assign one sensor to one failure mode. The table below consolidates that exercise for a typical pharma effluent train running at 500–2,000 m³/day with API synthesis, fermentation, and formulation streams mixed.
Equalization is the first signal-rich node: a radar level transmitter, pH, conductivity, and ORP at 1 s resolution detect batch arrivals and upset propagation before the train is dosed. On the headwork's rotary mechanical bar screens, motor current trending and vibration on the rake bearings catches ragging and chain stretch; a differential level switch upstream/downstream flags blinding within hours. The DAF units need an IP67 surface-scum camera for foam events, a sludge-blanket level sensor, and a stroke counter on the polymer dosing pump — loss of stroke count is the most common cause of clarified-water TSS excursions in pharma plants.
The MBR is the most failure-dense unit. DF-series PVDF MBR flat-sheet modules with transmembrane-pressure monitoring give a per-cassette TMP signal that rises 2–5 kPa before flux drops, giving 48–72 hours of warning on fouling. DO probes in each aeration zone, optical NIR MLSS, and capillary suction time (CST) trending close the picture; CST above 25 seconds reliably predicts biomass toxicity events 12–24 hours ahead (HydropureWater field data, 2026). On the RO side, HydropureWater industrial RO skids with high-pressure-pump vibration sensing combine pump vibration/temperature, inter-stage pressure, permeate conductivity, and per-vessel dP to flag fouling or scaling 2–3 days early. Chemical conditioning is handled by PLC-controlled automatic chemical dosing skids with stroke-counting sensors, which verify pump stroke rate, pH/conductivity probe calibration drift, and day-tank weight so a stuck diaphragm is caught before the next QA grab. The final barrier — a chlorine dioxide generator — needs reaction-cell temperature, feed-chemical flow ratio, and a generator-output titration trend; loss of the 5:1 precursor ratio is the leading cause of disinfection efficacy failures in pharma reuse loops.
| Unit Operation | Sensor | Failure Mode Detected | Typical Alarm Threshold | Data Frequency |
|---|---|---|---|---|
| Equalization tank | Radar level, pH, conductivity, ORP | Batch upset, slug load | pH <4 or >10; Δconductivity > 2 mS/cm/min | 1 s |
| Rotary bar screen | Motor current, vibration, Δlevel | Ragging, blinding, bearing wear | Vibration RMS > 7.1 mm/s; Δlevel > 200 mm | 1 s |
| DAF | Scum camera, sludge blanket, polymer stroke | Foam event, polymer failure | Stroke count deviation > 5% over 10 min | 10 s |
| MBR (DF flat-sheet) | Per-cassette TMP, DO, MLSS, CST | Membrane fouling, toxicity, biomass loss | TMP > 30 kPa; CST > 25 s; DO < 1.5 mg/L | 10 s |
| RO skid | HP-pump vibration/temp, inter-stage P, permeate C, vessel dP | Fouling, scaling, pump degradation | Permeate conductivity > 50 µS/cm; dP > 1.2 bar/vessel | 10 s |
| Chemical dosing | Stroke counter, day-tank weight, probe calibration | Stuck pump, calibration drift | Weight Δ < expected > 10% over 1 h | 60 s |
| ClO2 generator | Reaction cell temp, feed ratio, output titration | Precursor imbalance, efficacy loss | ClO2 residual < 0.5 mg/L after contact | 60 s |
Data Architecture: From Sensor to ML Prediction
Pharma OT/IT teams should resist the MapR-style over-engineered stack — a Linux installer plus a Kafka-plus-Spark-plus-OpenTSDB pipeline is rarely warranted for a 300–500-tag plant. A leaner reference architecture fits most sites: edge gateway (Siemens IOT2050, Schneider ETG, or Kepware OPC-UA) publishes tags to an on-premises MQTT broker, which writes to a time-series database (InfluxDB for greenfield, OSIsoft / AVEVA PI where the corporate standard exists, AWS Timestream for cloud-first deployments). Resolution is tiered: 1 s for vibration and motor current, 10 s for pressure and flow, 60 s for water-quality probes. Raw data is held at full resolution for 90 days for incident forensics, then downsampled to 1-minute aggregates for 3 years per typical pharma retention practice.
The ML layer should match model class to failure type. Anomaly detection (Isolation Forest for tabular features, autoencoder LSTM for multivariate vibration spectrograms) fits unlabeled rotating equipment and catches bearing defects 2–6 weeks before the ISO 10816 alarm band is crossed. Survival analysis (Random Survival Forest, Cox proportional hazards) is the right tool for MBR membrane replacement intervals because it models time-to-failure with censored data — exactly what you have when a membrane is still in service. Regression (XGBoost) handles continuous-output problems like RO flux vs. feedwater quality. Models retrain weekly on streaming data, run in a champion/challenger A/B frame against the existing SCADA threshold alarms for at least 4 weeks, and only promote when the false-positive rate drops below the baseline. The 2024 McKinsey Industry 4.0 survey reported 92% of manufacturers operate at least one PdM use case but only 18% have scaled beyond pilots; the gap is almost always governance and validation, not sensor count. A broader 2026 general engineering guide to predictive maintenance in wastewater plants covers the non-pharma-specific stack choices in more depth.
Validating a PdM System Under GMP and 21 CFR Part 11

QA's first objection is always the same: "is the ML model a validated system?" The defensible answer treats the SCADA/historian plus ML model as a GAMP 5 Category 4 configured product, while the model code itself is GAMP 5 Category 5 (custom code) per the 2022 ISPE GAMP 5 second-edition guidance. Required deliverables are standard pharma engineering: a User Requirements Specification (URS), Functional Requirements Specification (FRS), Design Specification (DS), and IQ/OQ/PQ protocols executed under change control. Audit-trail configuration must capture every model input, output, and retraining event with a tamper-evident hash; e-signatures on overridden alarms need biometric or password-plus-OTP workflow per 21 CFR Part 11 §11.200.
The validation sequence should be staged. Train the model first on non-GMP shadow data — historical process values with the GMP flag stripped — and qualify it in a parallel run. Revalidate after any retraining that crosses a defined drift threshold; Population Stability Index (PSI) above 0.2 on input features is a common trigger (per 2025 ISPE AI/ML validation good-practice note). Raw sensor data and model outputs must be retained for the life of the supported asset plus the regulatory minimum, which is 7–10 years for most pharma records. A full validation cycle on a 300-tag deployment runs $40K–$120K and takes 8–14 weeks; budget that line item explicitly and coordinate with QA before any OT/IT change-control is opened.
24-Month ROI Model and CAPEX/OPEX Breakdown
CAPEX scales with tag count and site count. A pilot on a single skid with ~50 tags runs $80K–$180K; a single full WWTP at 300–500 tags lands in the $250K–$650K band; multi-site enterprise rollouts run $1M–$3M. OPEX is typically 15–20% of CAPEX per year and covers cloud or PI licensing, OT cybersecurity (segmentation, patch cadence, key management), quarterly model retraining, and a fractional FTE for data engineering. Savings come from four documented drivers: 35–50% reduction in unplanned downtime hours, 20–30% maintenance-labour productivity gain, 5–10% chemical and energy optimization, and 15–25% membrane life extension (per 2024–2025 PdM benchmark studies in pharma and adjacent fine-chemical utilities, summarised in the decanter centrifuge spare parts and consumables 2026 OPEX breakdown).
Worked example for an 800 m³/day plant: 2 unplanned events per year × 12 hours each × $90K/h avoided = $2.16M/yr in downtime savings. Subtract $400K amortized CAPEX (over 5 years) plus $80K OPEX = roughly 3.3× annual ROI, with payback inside 18 months. Sensitivity matters: if downtime events drop only from 2 to 1.5 per year and avoided cost is $60K/h, payback still lands near 24 months. The case is robust enough to defend to a CFO provided the avoided-cost figure is anchored to a documented event history rather than a vendor brochure.
| Item | Pilot (1 skid, ~50 tags) | Single WWTP (300–500 tags) | Multi-site enterprise |
|---|---|---|---|
| CAPEX | $80K–$180K | $250K–$650K | $1M–$3M |
| Annual OPEX | $12K–$36K | $40K–$130K | $150K–$600K |
| Unplanned downtime reduction | 20–30% | 35–50% | 40–55% |
| Maintenance labour productivity | 10–15% | 20–30% | 25–35% |
| Membrane life extension | 5–10% | 15–25% | 20–30% |
| Typical payback | 18–30 months | 14–24 months | 12–20 months |
Frequently Asked Questions

What is a predictive maintenance system for a pharmaceutical wastewater plant?
A PdM system combines vibration, motor current, temperature, and water-quality sensors on rotating equipment and unit operations, streams the data to a time-series historian, and applies ML models — typically anomaly detection, survival analysis, and regression — to forecast failures 24–72 hours ahead with a confidence score routed to the CMMS.
How does 21 CFR Part 11 validation apply to ML-based PdM?
SCADA, historian, and the trained ML model together are validated as a GAMP 5 Category 4 configured system with Category 5 custom code; deliverables include URS, FRS, IQ/OQ/PQ, audit trail, e-signatures, and retraining triggered by Population Stability Index above 0.2 on input features.
What is the typical ROI for a pharma WWTP predictive maintenance deployment?
Single-site deployments at 300–500 tags typically achieve 35–50% reduction in unplanned downtime and 15–25% membrane life extension, yielding 3× annual ROI and 14–24 month payback when 2 events/yr at 12 h each are avoided at $60K–$90K/h loaded cost.
Which ML models are best suited for wastewater rotating equipment and membranes?
Anomaly detection (Isolation Forest, autoencoder LSTM) fits unlabeled vibration and current on pumps and blowers; Random Survival Forest models time-to-failure for MBR membranes with censored data; XGBoost regression handles RO flux decline against feedwater quality.
How long does a full 21 CFR Part 11 PdM validation take and what does it cost?
A typical 300-tag pharma WWTP validation cycle costs $40K–$120K and runs 8–14 weeks, covering URS through PQ, audit-trail configuration, e-signature workflow, and the change-control SOP that governs model retraining.