
What a Fenton Oxidation System Has to Do in 2026
A Fenton oxidation system is sized in six steps: characterise the influent (flow Q, COD, BOD, SS, alkalinity), calibrate H2O2:COD and Fe2+ doses in jar tests (pharma range 0.8–1.5 g H2O2/g COD; Fe2+ ≤ 80 mg/L), compute the working volume from a hydraulic residence time of 30–120 minutes, calculate the Fe(OH)3 sludge mass at 2–4 kg DS per kg Fe dosed, and lock pH at 2.5–3.5 with H2SO4. A bisulphite or catalase quench is mandatory before downstream biology to strip residual H2O2, which is biocidal above 10–20 mg/L. The two non-negotiables that govern every sizing decision are the narrow pH window and the destruction of residual peroxide before the effluent re-enters the activated-sludge or MBR stage.
Fenton is a heterogeneous advanced oxidation process in which Fe2+ catalyses H2O2 to generate hydroxyl radicals (·OH) with a redox potential of about 2.8 V — the second-highest practical oxidant after fluorine (HydropureWater field data, 2026). The reagent pair attacks C–H, C–C, and aromatic bonds non-selectively, which is why Fenton is deployed as a polishing step after biology to break the biorefractory API fraction that activated sludge cannot metabolise. The operating envelope is tight: pH 2.5–3.5. Above 4.0, ferric iron precipitates as Fe(OH)3, removing the catalyst and generating the excess sludge that downstream plate presses must handle. 2026 design practice positions Fenton downstream of an MBR or activated-sludge stage so that oxidant is spent on the recalcitrant fraction only, not on readily biodegradable COD that biology already removed. The sizing problem reduces to three numbers: a reactor volume, a chemical dose verified on the actual wastewater, and a sludge-handling capacity the project must finance alongside the reactor.
Step 1: Characterise the Influent Before Sizing Anything
Every Fenton sizing must rest on a minimum data set the laboratory confirms before the EPC freezes the reactor volume. Required inputs are flow Q in m³/d or m³/h, total COD and BOD5 in mg/L, total suspended solids, alkalinity as CaCO3, pH, temperature, chloride, and a representative API or recalcitrant fingerprint that identifies the molecule class the Fenton stage must attack.
The most common error at this step is sizing on total COD instead of recalcitrant COD. The Fenton dose must be applied to the recalcitrant fraction only — the residual after subtracting the biodegradable COD removed upstream by the MBR or activated-sludge stage. Sizing on total COD inflates the H2O2 dose and the reactor by 1.5–3×, depending on the BOD:COD ratio of the raw influent. Above 1,000 mg/L alkalinity, the acid demand to reach the pH 3.0 setpoint becomes a non-trivial OPEX line and must be priced into H2SO4 consumption. Field rule: if the lab has not run a 7-day composite of flow-paced samples, the sizing is provisional and the final reactor volume should be deferred until composite data is in. Jar-test calibration in Step 2 cannot compensate for a non-representative influent characterisation.
Step 2: Run a Jar Test to Lock the H2O2:COD and Fe2+ Doses
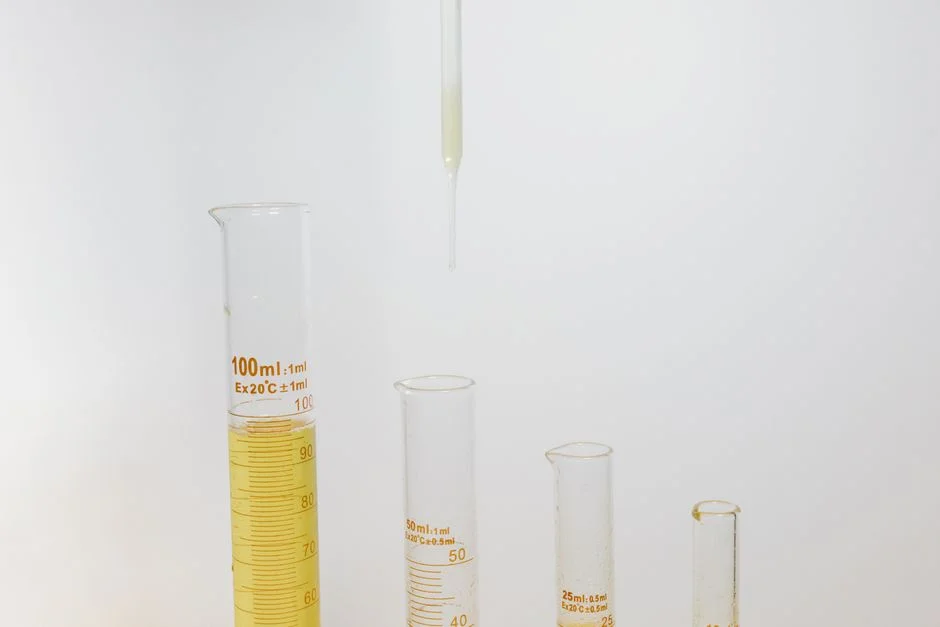
Jar testing is the calibration step that prevents the most common over-design error — applying the 2.1 g H2O2/g COD stoichiometric ceiling for full mineralisation when pharma practice only needs to break recalcitrant molecules into biodegradable intermediates. Industrial practice uses an H2O2:COD mass ratio between 0.5 and 2.0; the pharma retrofit range observed in 2024–2026 field data is 0.8–1.5 (HydropureWater field data, 2026). The stoichiometric ceiling for complete mineralisation of a generic hydrocarbon is 2.1 g H2O2 per g COD. Stricter literature on complex pharmaceutical matrices quotes 2:1 to 5:1 by weight, but that range should be treated as a worst-case ceiling rather than a design point, because the design target is conversion of biorefractory molecules into biodegradable intermediates (a rising BOD5:COD ratio), not total COD annihilation in the Fenton stage.
The iron dose is set in parallel. Fe2+ (added as FeSO4·7H2O) starts at 50 mg/L and rarely exceeds 80 mg/L; above that, hydroxyl-radical scavenging by excess Fe2+ reverses the yield curve and sludge volume rises faster than COD removal. The jar-test protocol: dose five 1 L samples across the 0.5–2.0 H2O2:COD range at constant 50 mg/L Fe2+ and pH 3.0, mix 60 minutes, settle 30 minutes, then measure residual COD, BOD5, and H2O2. Select the lowest H2O2:COD ratio that lifts the BOD5:COD ratio above 0.4 and meets the downstream discharge target. Over-dosing wastes reagent and produces residual peroxide that the downstream MBR biomass cannot tolerate; under-dosing leaves recalcitrant load that defeats the purpose of the stage.
Step 3: Calculate Reactor Volume from Hydraulic Residence Time
The missing formula in most public sizing references is how the working volume is actually derived from HRT, Q, and the dose verified in Step 2. Design HRT for classic Fenton is 30–120 minutes; 60 minutes is a robust default for pharma recalcitrant streams (HydropureWater field data, 2026). Reactor working volume follows V = Q × HRT, with 15–20% freeboard added for foam and the ORP probe immersion zone.
Worked example: Q = 50 m³/d = 2.08 m³/h. At 60 minutes HRT, V_working = 2.08 m³; with 20% freeboard, V_total ≈ 2.5 m³. This is the Fenton reaction tank only — equalisation, dosing, and quench vessels sit upstream and downstream. Geometry matters for mixing: a depth-to-diameter ratio of 1.0–1.2 keeps the impeller fully submerged and the velocity profile uniform, which prevents short-circuiting of peroxide-rich fluid along the wall. The bottom should be dished for sludge collection, and a mechanical agitator at 1.0–1.5 m/s tip speed is sufficient to keep iron in suspension without shearing the floc that feeds the downstream plate press. Materials: PE, PP, rubber-lined carbon steel, or FRP are the default; 316L stainless steel is required above 40 °C or where chloride exceeds 1,000 mg/L to avoid pitting corrosion in the pH 2.5–3.5 window. Dosing is split between one line for 30–50% H2O2 and one for FeSO4·7H2O solution, both metered by a PLC-controlled chemical dosing skid with flow-paced setpoints.
Step 4: Size Chemical Storage and the Dosing Skid
Translating the verified jar-test dose into a 24-hour, 7-day, and 30-day consumption is what converts a sizing study into a defensible CAPEX line item. For Q = 50 m³/d and a COD removal target of 60% at H2O2:COD = 1.0, daily H2O2 demand is approximately 25 kg/day expressed as 100% — or 50 kg/day of the 50% solution typically delivered in drums or IBCs. At 50 mg/L Fe2+, daily FeSO4·7H2O demand is 8.7 kg/day; weekly consumption is 61 kg, and the dosing skid tank should be sized for 7 days of autonomy to ride out supply interruptions. H2SO4 for acidification and NaOH for post-reaction neutralisation are fixed OPEX line items; budget 0.5–1.0 kg H2SO4 per m³ treated at typical feed alkalinity, with NaOH sized at roughly 0.6–0.8 kg per m³ for the neutralisation step back to pH 7.
Specifying 50% H2O2 cuts storage volume in half compared with 30%, but it requires a vented dosing room, compatible seals (PTFE or EPDM), dilution-water cooling, and a PLC-controlled metering pump with flow-paced setpoints and a peroxide-resistant diaphragm. PE/PP day tanks, bunding at 110% of the largest container, and eyewash stations within 10 m complete the safety scope. Storage temperature must stay below 30 °C to prevent self-accelerated decomposition.
| Parameter | Unit | Design range (2024–2026 pharma retrofit) | Worked example: Q = 50 m³/d |
|---|---|---|---|
| HRT | min | 30–120 | 60 |
| Reactor working volume | m³ | 0.5–20 | 2.08 |
| Reactor total volume (with 20% freeboard) | m³ | 0.6–24 | 2.5 |
| H2O2:COD mass ratio | g/g | 0.8–1.5 (design); 0.5–2.0 (industrial range); 2.1 (stoichiometric ceiling) | 1.0 |
| Daily H2O2 (50% solution) | kg/day | 5–250 | 50 |
| Fe2+ dose | mg/L | 20–80 | 50 |
| Daily FeSO4·7H2O | kg/day | 1–50 | 8.7 |
| H2SO4 consumption | kg/m³ | 0.5–1.0 | 0.7 |
| NaOH neutralisation | kg/m³ | 0.6–0.8 | 0.7 |
| Fe(OH)3 sludge yield | kg DS/kg Fe | 2–4 | 2.2–4.4 kg DS/day at 1.1 kg Fe/day |
Step 5: Calculate Iron Sludge and the Quench Load
Iron sludge is the line item most vendor quotes omit and most EPC budgets underestimate. Fe(OH)3 sludge yield is 2–4 kg dry solids per kg Fe dosed (HydropureWater field data, 2026). At 8.7 kg/day FeSO4·7H2O, which delivers approximately 1.1 kg/day of elemental Fe, the Fenton stage produces 2.2–4.4 kg DS/day of iron sludge before the COD-derived TSS is added. Coupled with the suspended solids generated by the reaction, this total sludge mass sets the downstream plate-and-frame filter press sizing — the iron cake is dense, gelatinous, and difficult to dewater below 25–30% DS without a polyelectrolyte dose of 2–4 kg/t DS.
The second non-negotiable is the residual-peroxide quench. Residual H2O2 above 10–20 mg/L is biocidal to MBR biomass; a quench tank with sodium bisulphite (SBS) or a biological catalase polishing step is mandatory before the Fenton effluent returns to biology. SBS dose is typically 1.5–2.0 g per g of residual H2O2, with a 5–10 minute contact time in a mixed tank sized at 15–30 minutes HRT. Catalase is preferred where the discharge limit on sulphate is tight, because SBS loads the effluent with roughly 1.5 kg SO4²⁻ per kg of residual peroxide destroyed. The quench tank volume is a small fraction of the Fenton reactor (1–3% of total Fenton volume in most retrofits), but it must be included in the CAPEX or downstream biology will fail within days of first start-up.
Step 6: Instrumentation, ORP Plateau, and Validation
Control and validation instruments are the difference between a Fenton skid that performs as designed and one that drifts into either peroxide waste or catalyst precipitation. Redundant pH probes (±0.1 accuracy) on the reaction tank feed the H2SO4 and NaOH dosing loops; an ORP probe serves as the end-point signal for H2O2 exhaustion, and a stable ORP plateau (typically within ±20 mV over 5 minutes) means the reaction is complete and the effluent can move to the quench tank.
Continuous online TOC, COD, and UV254 monitoring gives real-time performance evidence to both the regulator and the upstream biology operator; UV254 in particular tracks aromatic-API destruction without waiting for a wet-chemistry COD turnaround. API removal validation follows pharmaceutical practice: HPLC-MS/MS at ng/L to µg/L detection, with the target list covering both parent compounds and known transformation products. Ecotoxicity is paired with chemistry so transformation products that are more toxic than the parent API are caught before discharge — Daphnia magna 48-hour acute immobilisation (OECD 202) and Vibrio fischeri bioluminescence inhibition (ISO 11348) are the two standard assays. Sampling cadence: 24-hour composite during commissioning, weekly composites thereafter, with grab samples taken at every shift change in continuous duty so a process upset is traceable to the hour.
When to Pick Photo-Fenton or Electro-Fenton Instead
Variants beat classic Fenton when one matrix or site constraint dominates the OPEX. Photo-Fenton adds UV to accelerate Fe3+ → Fe2+ regeneration, which cuts both iron dose and sludge volume by 30–50% in clean matrices; the trade-off is that the influent turbidity must stay below 30 NTU or UV is screened out and the benefit collapses. Photo-Fenton is the right pick when colour and turbidity are low and sludge disposal is the dominant operating cost.
Electro-Fenton generates H2O2 in-situ at the cathode from sparged oxygen, eliminating 50% H2O2 drum storage on the plant floor — a strong fit for high-potency or genotoxic API suites where bulk peroxide storage is a regulatory headache. DC rectifier load runs 5–15 kWh/m³ depending on influent COD, and the system tolerates moderate colour but needs adequate conductivity. The decision rule: stay with classic Fenton when influent turbidity is high, the operator accepts iron sludge, and bulk peroxide storage is operationally fine. Move to photo-Fenton when colour and turbidity are low and sludge disposal is the dominant OPEX line. Move to electro-Fenton when the plant cannot accept 50% H2O2 inventory on site. A side-by-side comparison of AOP options for high-strength industrial matrices is covered in the 2026 engineering guide to AOP systems for adhesive manufacturing wastewater.
Sizing Pitfalls That Waste 20–40% of Reactor Volume
Four scale-up errors recur in 2024–2026 Fenton retrofits. Pitfall 1 is sizing on total COD instead of recalcitrant COD; the upstream biology already removed the easy fraction, and sizing on total inflates the H2O2 dose, the reactor, and the OPEX by 1.5–3×. Pitfall 2 is skipping the bisulphite or catalase quench; even 10–20 mg/L of residual H2O2 will wipe out the downstream MBR biomass and force a restart that costs days of lost treatment capacity.
Pitfall 3 is letting pH drift above 4.0. Fe(OH)3 precipitation both kills the catalyst and adds a hidden 1.5–2× sludge load that the dewatering budget never planned for. Redundant pH probes and aggressive H2SO4 trim are the only insurance. Pitfall 4 is ignoring the reaction exotherm in concentrated streams. Classic Fenton is mildly exothermic — typically a 5–10 °C temperature rise without external heating — and the design must either allow for that rise against the downstream biology temperature limit or move to electro-Fenton, where dosing is more controllable. Each of these pitfalls is preventable with a one-page design review before the reactor is fabricated, and each adds 5–15% to the project CAPEX when caught after fabrication. For projects where the operator will run the plant under a service contract, the 2026 guide to performance-based wastewater O&M contracts sets out how to align the Fenton acceptance criteria with contract penalties.
Frequently Asked Questions
What is the typical H2O2:COD ratio for a pharmaceutical Fenton stage?
The pharma retrofit range observed in 2024–2026 field data is 0.8–1.5 g H2O2 per g COD (HydropureWater field data, 2026). The industrial range is 0.5–2.0, and the stoichiometric ceiling for full mineralisation of a generic hydrocarbon is 2.1 g H2O2 per g COD. Jar testing on the actual wastewater is the only way to lock the design ratio.
What hydraulic residence time should I use for the Fenton reactor?
Design HRT for classic Fenton is 30–120 minutes; 60 minutes is a robust default for pharma recalcitrant streams. Add 15–20% freeboard for foam and the ORP probe immersion zone, and verify the HRT against the actual reaction time observed in the jar test.
How much iron sludge does a Fenton system produce?
Fe(OH)3 sludge yield is 2–4 kg dry solids per kg Fe dosed. At 50 mg/L Fe2+ on a 50 m³/d flow, expect 2.2–4.4 kg DS/day of iron sludge, which sets the downstream plate-and-frame filter press capacity.
Why is a bisulphite or catalase quench mandatory?
Residual H2O2 above 10–20 mg/L is biocidal to MBR biomass. A sodium bisulphite dose of 1.5–2.0 g per g residual H2O2, or a catalase polishing step, must strip residual peroxide before the Fenton effluent returns to biology, or the downstream stage will fail within days of start-up.