Why Hospital Effluent Technology Applies to Food Processing
Hospital wastewater and food processing effluent share three load vectors that justify a common treatment core: high biodegradable organics, pathogen concentrations of 105–107 CFU/100 mL, and recalcitrant micropollutants. Hospital streams contain 0.2–10 μg/L of pharmaceutical compounds (Springer 2017, Beier et al. 2012); food plants carry surfactant and lipid fractions that foul membranes through the same mechanisms. The hospital wastewater engineering guide for the US describes MBR with PVDF hollow-fiber membranes at 0.1 μm pore size as the reference configuration for stripping both vectors in a single stage.
Food processors adopt this hospital-grade core because 2026 reuse targets are tightening faster than discharge limits. Direct process-contact reuse typically requires COD ≤50 mg/L and E. coli ≤0 CFU/100 mL, a bar conventional activated sludge rarely clears without polishing. The WHO 2024 update on antimicrobial resistance in wastewater added pressure: regulators now scrutinize antibiotic-resistant gene (ARG) discharge from any site co-located with healthcare or pharmaceutical supply chains, and food plants receiving animal-source ingredients fall inside that perimeter. An MBR + ClO₂ train delivers 3–4 log ARG reduction alongside the COD and TSS numbers that satisfy EPA secondary standards and EU 91/271/EEC.
| Parameter | Hospital Effluent (typical) | Food Processing Effluent (typical) |
|---|---|---|
| COD | 200–1,000 mg/L | 800–5,000 mg/L |
| BOD₅ | 100–500 mg/L | 500–3,000 mg/L |
| TSS | 100–350 mg/L | 500–4,000 mg/L |
| FOG | 20–80 mg/L | 200–2,500 mg/L |
| Pharmaceutical / surfactant load | 0.2–10 μg/L (drug compounds) | 50–500 mg/L (surfactants, proteins) |
| Target reuse quality | Discharge compliance | COD ≤50 mg/L, E. coli ≤0 CFU/100 mL |
Influent Characterization: Hospital vs. Food Processing Effluent
Hospital streams run cooler, cleaner, and more toxic per litre; food streams run hotter, dirtier, and far more variable. That asymmetry drives different pretreatment emphasis but the same downstream biology. Hospital wastewater carries 100–350 mg/L TSS, while meat-processing streams reach 4,000 mg/L TSS during cleanup shifts; both must drop to ≤5 mg/L before reuse, which is why MBR with PVDF membranes has displaced conventional secondary clarification in both sectors (HydropureWater field data, 2026).
Ammonia is the second axis that separates designs. Hospital effluent typically runs 10–60 mg/L NH₃-N; dairy and meat streams run 20–200 mg/L NH₃-N. Higher influent ammonia forces longer SRT (30–40 days versus 20–25 days at hospitals) to keep free ammonia below 1.5 mg/L in the MBR tank, protecting nitrifiers from washout. pH is the third axis: hospitals sit in a narrow 6.5–8.0 band, while fruit and vegetable processors swing from 4.0 to 11.0 across a single shift. That range kills nitrification if fed directly to an MBR, so equalization with PLC-controlled acid/caustic dosing is non-negotiable for food sites.
| Parameter | Hospital | Dairy | Meat Processing | Vegetable Processing |
|---|---|---|---|---|
| COD (mg/L) | 200–1,000 | 1,500–5,000 | 2,000–5,000 | 800–2,500 |
| BOD₅ (mg/L) | 100–500 | 800–3,000 | 1,000–3,000 | 500–1,800 |
| TSS (mg/L) | 100–350 | 500–1,500 | 1,000–4,000 | 300–2,000 |
| FOG (mg/L) | 20–80 | 200–1,000 | 500–2,500 | 50–300 |
| Total Nitrogen (mg/L) | 20–70 | 50–200 | 100–250 | 30–120 |
| Total Phosphorus (mg/L) | 5–15 | 10–50 | 15–60 | 5–25 |
| E. coli (CFU/100 mL) | 104–106 | 105–107 | 105–107 | 104–106 |
| pH | 6.5–8.0 | 6.0–9.0 | 6.5–9.5 | 4.0–11.0 |
Process Train: From Hospital Standard to Food-Adapted MBR Plant
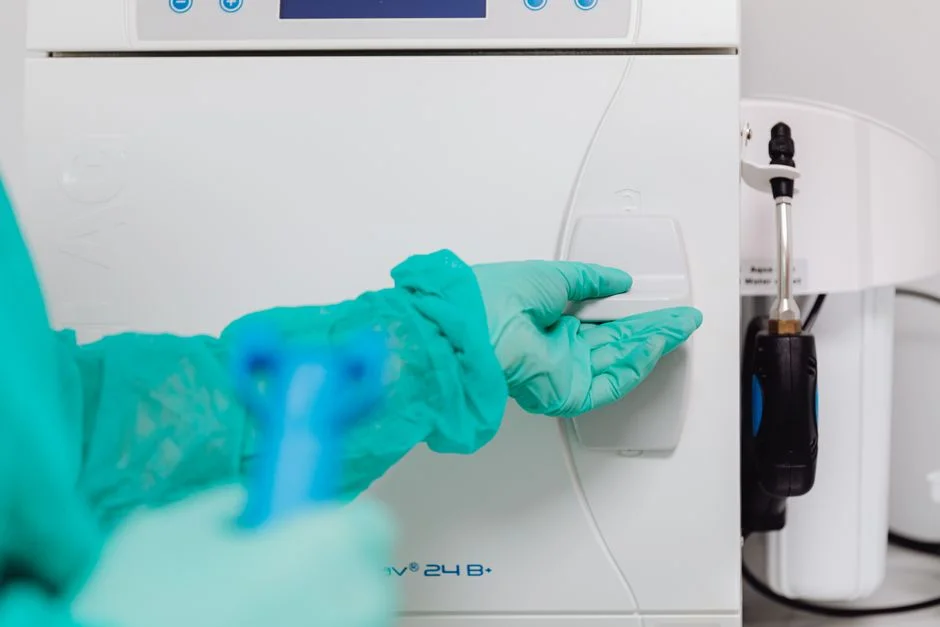
A six-stage train adapts hospital MBR design to food-plant influent without over-specifying. The skeleton stays the same; the FOG handling and equalization step get beefed up.
- Screening. A GX rotary bar screen with 5–10 mm aperture removes 30–60% of gross solids before the equalization tank. Finer 2–3 mm apertures are recommended for meat plants where bone fragments and paunch manure enter the stream.
- Equalization and pH correction. 6–12 h HRT buffer absorbs pH and load swings; a PLC-controlled chemical dosing skid doses NaOH or H₂SO₄ to hold the tank at pH 6.5–7.5, the range where nitrifiers stay active and FOG emulsions break predictably.
- DAF pretreatment. A DAF system is mandatory when FOG exceeds 200 mg/L. An air-to-solid ratio of 0.03–0.08 kg air/kg TSS achieves >90% FOG removal and 50–80% TSS reduction, dropping the MBR's organic load and protecting membrane surfaces from irreversible fouling.
- MBR with submerged PVDF membranes. An integrated MBR system with 0.1 μm hollow-fiber modules runs at HRT 4–8 h, SRT 20–40 d, and MLSS 8,000–12,000 mg/L. Effluent targets: COD ≤50 mg/L, TSS ≤5 mg/L, turbidity ≤1 NTU. Reference designs for the membrane area calculation are summarized in the hollow fiber MBR engineering guide.
- Disinfection. A ClO₂ generator dosing 1.5–2.0 mg/L with 30 min contact time achieves 99.99% E. coli kill and 3-log ARG reduction. Ozone at 5–10 mg/L with 15 min contact is a valid alternative when distribution pipework is short; long loops favour ClO₂ for residual stability.
- Sludge dewatering. A plate-and-frame filter press or decanter centrifuge dewaters waste activated sludge to 22–28% dry solids for off-site disposal or co-digestion.
| Stage | Equipment | Operating Parameter | Design Value |
|---|---|---|---|
| 1 | GX rotary bar screen | Aperture | 5–10 mm |
| 2 | Equalization + dosing | HRT | 6–12 h |
| 3 | DAF | Air-to-solid ratio | 0.03–0.08 |
| 4 | Submerged PVDF MBR | SRT / MLSS | 20–40 d / 8,000–12,000 mg/L |
| 5 | ClO₂ generator | Dose / contact | 1.5–2.0 mg/L / 30 min |
| 6 | Plate-and-frame press | Cake DS | 22–28% |
When to Choose Hospital-Grade vs. Conventional Food Plant Treatment
The decision is governed by three questions: what is the discharge or reuse obligation, what is the influent composition, and what regulatory pressure applies to ARG or pharmaceutical residue discharge. The matrix below maps those inputs to a recommended train.
| Scenario | Recommended Train | OPEX Range (per m³) | CAPEX Implication |
|---|---|---|---|
| Discharge to municipal sewer, no reuse target | Conventional activated sludge + chlorination | $0.05–$0.12 | Baseline |
| ≥50% reuse mandate, or co-located with hospital/clinic | MBR + ClO₂, with DAF if FOG >200 mg/L | $0.18–$0.35 | +60–100% vs. baseline |
| Antibiotic or hormone residues from upstream supply chain | MBR + advanced oxidation (ozone or AOP) | $0.25–$0.45 | +80–120% vs. baseline |
| High-FOG stream (meat, dairy) without reuse | DAF + MBR (no advanced oxidation) | $0.15–$0.28 | +30–50% vs. baseline |
| Vegetable-only stream, discharge only | MBR (no DAF), basic chlorination | $0.10–$0.20 | +15–20% vs. baseline (saves DAF) |
A practical rule: if freshwater purchase exceeds $1.50/m³ and reuse displaces more than half the influent, hospital-grade MBR pays back inside five years. If the site is sewer-only with cheap water and no ARG scrutiny, conventional treatment is the right call and the extra CAPEX is wasted capital.
2026 CAPEX, OPEX, and ROI for Hospital-Grade Food Plant ETP
For a packaged 50 m³/day system, CAPEX in 2026 sits between $120,000 and $250,000. A 500 m³/day plant scales roughly linearly to $900,000–$2.1M, with membrane modules and stainless-steel tankage dominating the equipment bill (per 2026 food-plant treatment benchmarks, as detailed in the vegetable processing ETP pricing 2026 reference).
OPEX breaks down as follows for a hospital-grade food plant train: energy 40% (membrane aeration is the largest single load), chemicals 25% (ClO₂ precursor, NaOH/H₂SO₄, coagulant), labor 20%, sludge handling 10%, and membrane replacement 5% (PVDF modules typically last 5–7 years with proper cleaning). Reuse economics drive the business case: 60–80% water recovery displaces $1.20–$2.50/m³ of freshwater purchase in most regions, yielding a 3–6 year payback when reuse is mandated. Several 2026 Asian and Middle Eastern utility programs offer green-finance subsidies covering 20–40% of CAPEX for ARG-mitigating treatment, which can shorten payback below three years for qualifying food processors.
Compliance Checklist: 2026 Discharge and Reuse Standards
| Standard | Key Limits | Achieved At |
|---|---|---|
| EPA secondary treatment (40 CFR 133) | BOD₅ ≤30 mg/L, TSS ≤30 mg/L | MBR effluent stage |
| EU 91/271/EEC (10,000–100,000 PE) | COD ≤125 mg/L, BOD ≤25 mg/L, TP ≤2 mg/L | MBR + chemical precipitation for TP |
| WHO Guidelines for Drinking-water Quality (4th ed. update) | E. coli ≤0 CFU/100 mL for food-contact reuse | ClO₂ residual maintenance |
| FDA 21 CFR 117.80 (food facility sanitation) | Reuse water of safe sanitary quality | MBR + ClO₂ train when validated |
Validation matters: ClO₂ residual must be measured at the point of use, not just at the generator. UV disinfection alone is insufficient for food-grade reuse because it provides no residual and delivers <2-log ARG reduction in turbid water.
Frequently Asked Questions
Can hospital effluent treatment be used for food processing wastewater?
Yes. The MBR + advanced disinfection core is directly applicable; the main adaptation is adding DAF pretreatment when FOG exceeds 200 mg/L to keep membrane fouling rates in spec.
What is the typical cost of a hospital-grade food plant ETP in 2026?
CAPEX ranges from $120,000 for a 50 m³/day packaged system to $2.1M for a 500 m³/day plant, with OPEX at $0.18–$0.35/m³ depending on flow and reuse rate.
Which disinfection is best for food-grade reuse water?
Chlorine dioxide at 1.5–2.0 mg/L offers the best residual stability for distribution loops. Ozone at 5–10 mg/L is preferred when no long pipe runs exist and footprint is constrained.
How much water can a food plant reuse with MBR treatment?
Typically 60–80% of influent flow, depending on whether an RO polishing step is added for the cleanest reuse streams.
Does hospital-grade treatment remove antibiotic-resistant bacteria?
Yes. MBR + ClO₂ achieves 3–4 log ARG reduction; UV alone is insufficient for food reuse because it leaves no residual and underperforms in water above 1 NTU.