Why Foundry Wastewater Breaks Conventional Treatment Designs
A foundry wastewater treatment system that worked for 15 years can fail inside one shift when phenolic resin concentration jumps from 200 mg/L to 4,000 mg/L — that is not a maintenance problem, it is a unit-operation gap. In one eastern-China iron foundry the MBR lost 60% of its MLVSS within 48 hours because phenolic resin from a no-bake core line was sent straight to the bioreactor with no DAF or resin-precipitation step upstream; the post-incident root cause was missing pre-treatment, not bad housekeeping (HydropureWater field data, 2025-11).
Foundry effluent is fundamentally different from generic industrial wastewater because four contaminant streams converge in one equalization basin: green-sand loop overflow (silica, bentonite, clay, total suspended solids 1,000–5,000 mg/L); phenolic and furan resin washwater (COD 2,000–10,000 mg/L, often biocidal at concentrations above 1,500 mg/L); die-lubricant and quench oils (free plus emulsified, 100–2,000 mg/L oil & grease); and pickling/electroplating rinse waters carrying soluble Fe, Zn, Cu, Ni, Cr at 10–200 mg/L total metals. EPA's Iron and Steel Sector Notebook (2000-era characterization, still the baseline) lists influent TSS up to 3,500 mg/L and COD 2,000–8,000 mg/L for integrated steel-mill wastewater — green-sand iron foundries sit at the high end of that range.
The thermal load is the silent killer. Green-sand loop water routinely reaches 50–60 °C, and at those temperatures nitrifying bacteria denature and biological kinetics shift, so any MBR or activated-sludge stage without upstream cooling collapses within days. The DL/T 5210.6-2009 code circulating in the current SERP still mandates a four-tank baseline (water-collecting, oil-collecting, sludge settling, aeration chamber), but a 2026-compliant foundry design needs a fifth dedicated resin/quench stream segregated before equalization. Send the phenolic stream to chemical precipitation, not to the biology.
Foundry Wastewater Contaminant Map and Discharge Targets for 2026
Discharge limits in 2026 are tightening in three of the four major foundry jurisdictions simultaneously, and the inflection point is heavy metals — not COD. The table below is the reference a process engineer should print and pin above the control desk; every number is a regulatory target, not a design aspiration.
| Contaminant class | 2026 target effluent | China GB 8978-1996 Class 1 | EU IPPC BREF Smitheries & Foundries (2024 update) | US EPA 40 CFR 433 Metal Finishing |
|---|---|---|---|---|
| Total suspended solids | ≤30 mg/L | 70 mg/L | ≤30 mg/L | ≤30 mg/L (monthly avg) |
| Oil & grease | ≤5 mg/L | 5 mg/L | ≤5 mg/L | ≤52 mg/L (categorical; tighten locally) |
| COD | ≤100 mg/L | 100 mg/L | ≤120 mg/L | — (BOD tracked instead) |
| BOD | ≤20 mg/L | 20 mg/L | ≤25 mg/L | ≤26 mg/L (monthly avg) |
| Phenolic resin / phenol index | ≤0.5 mg/L | 0.3 mg/L (Class 1) | ≤0.5 mg/L | case-by-case NPDES |
| Total heavy metals | ≤1 mg/L | — (sum not specified) | ≤1 mg/L | — (individual limits apply) |
| Cu / Ni / Cr (each) | ≤0.5 mg/L | 0.5 mg/L | 0.5 mg/L | 2.07 / 2.38 / 2.77 mg/L (2025 revision tightens) |
| Zn / Fe (each) | ≤2.0 mg/L | 2.0 mg/L | 2.0 mg/L | 1.48 / — mg/L |
| pH | 6–9 | 6–9 | 6–9 | 6–9 |
| Temperature at discharge | ≤35 °C | ≤35 °C | ≤30 °C where local receiving water allows | state-specific |
India CPCB and Indonesia PP 22/2021 are both tightening in 2026 — plants exporting into those jurisdictions should budget 10–15% more for advanced polishing (activated carbon or selective ion exchange) to chase sub-1 mg/L total metals consistently, not just on the monthly composite sample.
The Standard Foundry Process Train: From Sand to Sludge
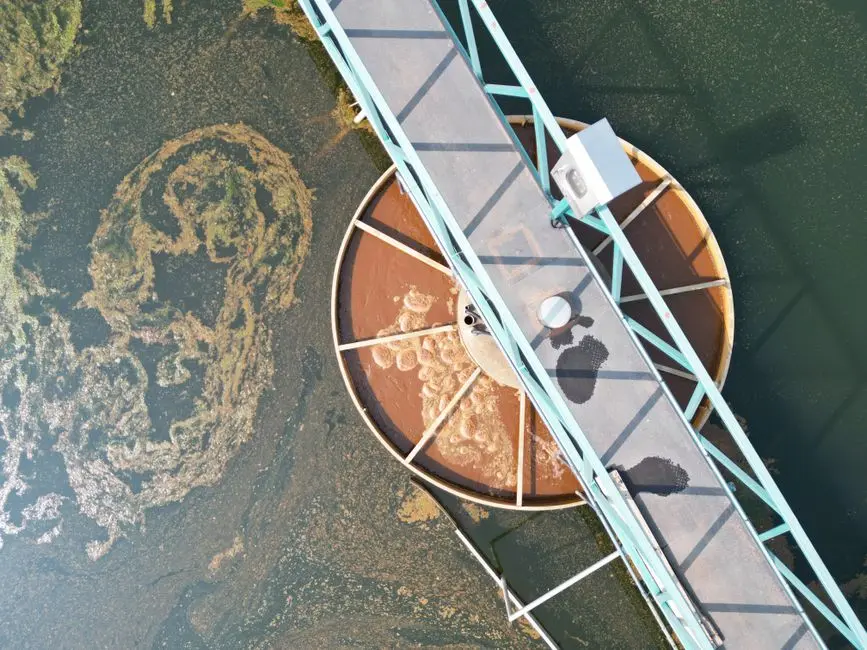
A defensible P&ID for a 50 m³/h green-sand iron foundry walks through eight unit operations in this exact order; skip any of them and one contaminant class will slip through. The train below is what a regulator will look for in an audit, and what a competent vendor's proposal should mirror line by line.
| Step | Unit operation | Primary removal target | Typical removal efficiency |
|---|---|---|---|
| 1 | Coarse screening — rotary mechanical bar screen, 5–10 mm aperture | Wood chips, cores, sand lumps, rags | >90% of >5 mm debris |
| 2 | Equalization / cooling basin, 8–24 h HRT, heat-exchange coil | Flow + temperature damping | ΔT reduced 15–25 °C |
| 3 | DAF — dissolved air flotation, A/S 0.3–0.5%, micro-bubble 10–50 μm | Free + emulsified oil, TSS, partial COD | 90–95% O&G; 70–85% TSS |
| 4 | Chemical precipitation — pH 8.5–9.5, PAC 50–200 mg/L, anionic PAM 1–5 mg/L | Dissolved heavy metals, residual COD | 95–99% metals as hydroxide; 60–80% COD |
| 5 | Lamella clarification + multi-media sand filter, 20–40 m/h surface loading | Floc carryover, TSS polishing | TSS ≤10 mg/L post-filter |
| 6 | MBR — submerged PVDF 0.1–0.4 μm membrane | Residual COD, BOD, total bacteria | COD ≤100 mg/L; 4-log bacteria |
| 7 | Activated carbon or ion exchange (optional) | Trace metals, color, refractory COD | Sub-1 mg/L metals, 50–80% color |
| 8 | Sludge dewatering — plate and frame filter press | DS cake 25–35% | >95% water recovery to head of plant |
Step-by-step, the equipment selection looks like this. The first line of defense is a GX series rotary mechanical bar screen at 5–10 mm aperture protecting the downstream pump gallery from sand lumps and core fragments. Equalization runs 8–24 h HRT with a mechanical mixer and a stainless heat-exchange coil — the coil is non-negotiable for foundries pouring at 50–60 °C. The dissolved air flotation system at 4–40 m³/h per unit and A/S 0.3–0.5% is the workhorse for oil, TSS, and partial COD removal — 90–95% O&G and 70–85% TSS in a single pass is the realistic envelope. Chemical precipitation uses an automatic chemical dosing system to lift pH to 8.5–9.5 with NaOH or lime, dose 50–200 mg/L PAC and 1–5 mg/L anionic PAM, and trigger sulfide or DTC precipitation when Cr(VI) limits demand it. A lamella clarifier / high-efficiency sedimentation tank at 20–40 m/h surface loading followed by a multi-media filter is what gets TSS down to ≤10 mg/L and protects the MBR membrane from fouling. The MBR membrane bioreactor system at 0.1–0.4 μm pore size and 10–2,000 m³/day capacity takes residual COD below 100 mg/L and produces effluent good enough for slag-cooling reuse. Finally, a plate and frame filter press at 1–500 m² filtration area dewaters the combined DAF float and clarifier sludge to 25–35% DS cake, which is the threshold that makes hazardous-waste transport economically defensible rather than a daily truck cost.
For plants chasing Zero Liquid Discharge in water-scarce regions, the MBR permeate feeds a brackish-water RO skid followed by an evaporator/crystallizer — a Zero Liquid Discharge design case study walks through the same 50 m³/h envelope at 2026 pricing.
Equipment Sizing and Specification for a 50 m³/h Foundry Plant
Below is the line-by-line equipment list a 50 m³/h green-sand iron foundry should see in a vendor proposal; if any line is missing, the design has a hole. Material of construction splits at the rinse-water stream — SS304 is fine for general foundry service, but SS316L is mandatory anywhere chloride-bearing pickling rinse water touches the equipment.
| Unit operation | Model / spec | Capacity | Footprint (m²) | Power (kW) | MOC |
|---|---|---|---|---|---|
| Bar screen | GX-800 | 50 m³/h, 5 mm aperture | 4 | 1.5 | SS304 |
| Equalization basin | In-line, with mixer + cooling coil | 600 m³ (12 h HRT) | 120 | 7.5 (mixer) | Concrete + SS316L coil |
| DAF | DAF-50 | 50 m³/h, A/S 0.4% | 18 | 11 | SS304 / SS316L |
| Chemical dosing skid | 3-tank (NaOH, PAC, PAM) | 200 L PE tanks | 6 | 2.2 | PE + SS316L piping |
| Lamella clarifier | HES-50 | 50 m³/h, 25 m/h surface loading | 14 | 4.0 | SS304 with FRP lamellas |
| Multi-media filter | MMF-30 | 30 m³/h, sand + anthracite | 8 | 0.75 | Rubber-lined CS |
| MBR skid | MBR-120 | ~120 m² membrane area | 25 | 22 (permeate + aeration) | PVDF membrane, SS304 frame |
| Activated carbon (optional) | AC-20 | 20 m³/h | 10 | 1.5 | SS304 |
| Plate filter press | FP-30 | 30 m² filtration area | 20 | 11 | PP plates, SS316L frame |
| Sludge hopper + conveyor | — | 5 m³ hopper | 12 | 3.0 | SS304 |
Total connected load for the 50 m³/h envelope runs 180–240 kW, dominated by the MBR blower and the filter press hydraulic pack. Control architecture is a PLC cabinet with HMI, 4–20 mA on pH, TSS, dissolved oxygen, and tank level; SCADA is optional but increasingly expected in 2026 procurement. Remote monitoring add-ons sit in the USD 8K–25K range depending on telemetry scope. Online chromium monitoring and online zinc monitoring sensor selection are the two analyzer additions that pay back fastest where the 2026 metal limits bite.
2026 CAPEX and OPEX Benchmarks by Plant Size
The numbers below are 2026 turnkey installed prices for a foundry in a coastal industrial park, equipment + civil + installation + commissioning + first-year spares; remote sites, seismic zones, or hazardous-area electrical will push these ranges 20–35% higher.
| Plant size | CAPEX envelope (USD) | Build type | Notes |
|---|---|---|---|
| 10 m³/h | 120K–350K | Containerized / skid-mounted package | Suits jobbing or non-ferrous foundry; single 40 ft skid possible |
| 50 m³/h | 350K–1.2M | Concrete equalization + skid-mounted mechanical | Most common green-sand iron foundry size |
| 200 m³/h | 1.5M–4.5M | Full civil build, optional ZLD add-on | Integrated steel-mill or large non-ferrous casting complex |
OPEX for a well-run foundry plant breaks down as: electrical USD 0.08–0.15/m³, chemicals USD 0.18–0.35/m³ (NaOH, lime, PAC, PAM, plus coagulant aid), labor USD 0.05–0.20/m³, and sludge disposal USD 0.10–0.30/m³. Total operating cost sits in the USD 0.40–0.90/m³ band. Sludge is the line item that flips the OPEX math — at 5–8 kg DS per m³ treated, a 50 m³/h foundry produces 6–10 tonnes of dewatered cake per day, and the difference between hazardous-waste tipping at USD 200/tonne and non-hazardous at USD 60/tonne is USD 1,000+ per day of OPEX, which over a year dwarfs every other line item on the table.
Frequently Asked Questions
Q1 — DAF vs API oil separator: which is right for foundry quench water?
Use DAF. API separators only remove free oil that rises in 30+ minutes; foundry quench water carries 100–2,000 mg/L of emulsified oil that will pass straight through an API. A dissolved air flotation system at A/S 0.3–0.5% with 10–50 μm micro-bubbles achieves 90–95% O&G removal in one pass, including the emulsified fraction. Reserve API separators only as a pre-DAF gross-oil guard for very high free-oil spikes.
Q2 — Can foundry wastewater be reused in slag cooling or sand preparation?
Yes, after MBR + activated carbon polishing. Reuse in slag cooling typically requires TSS ≤10 mg/L, Cl⁻ ≤200 mg/L, and temperature ≤35 °C; MBR effluent meets the first two but a cooling tower or holding tank handles the third. For green-sand preparation, additional hardness and sulfate control is needed, and most plants blend 30–50% reuse with fresh water to protect bentonite bond integrity.
Q3 — Is foundry sludge classified as hazardous waste in the EU and US?
Usually yes, but it is contaminant-driven, not foundry-driven. DAF float and clarifier sludge from iron foundries typically fails the US EPA TCLP test for lead or cadmium, triggering RCRA hazardous classification (Code K061 or similar). In the EU, EWC code 11 02 02 covers zinc-rich and 11 02 03 for copper-bearing sludges. Plate-filter-pressed cake at 25–35% DS is the form usually transported; verify with the local disposal site's waste acceptance criteria.
Q4 — How does phenolic resin concentration affect biological treatment design?
Phenolic resin above ~1,500 mg/L is biocidal to most activated-sludge and MBR biomass; MLVSS collapses and COD removal efficiency drops by 60–80% within 48 hours. The fix is upstream removal — Fenton's oxidation (H₂O₂/Fe²⁺ at pH 3–4) or coagulation with PAC at 200–400 mg/L can pull resin-bound COD down 50–70% before the bioreactor. Never send untreated no-bake core wastewater directly to a biological stage.
Q5 — When does a foundry need Zero Liquid Discharge (ZLD) instead of standard treatment?
ZLD becomes economic when (a) local water cost exceeds USD 1.50/m³, (b) the receiving water body is hypersensitive or already over-allocated, or (c) the plant is in a water-stressed basin (northwest China, western India, GCC, or US Southwest). A 50 m³/h foundry ZLD typically adds USD 1.8M–3.5M to CAPEX and lifts OPEX to USD 1.20–2.00/m³, so it is a 5–8 year payback decision driven by water pricing and discharge consent risk rather than a default choice.