Why Enzyme Manufacturing Wastewater Is a Different Biological Challenge
Enzyme manufacturing wastewater is not "high-strength industrial effluent" in the generic sense — it carries a specific mix of residual fermentation substrates, intact mycelium, antifoam silicones, and CIP chemistry that punishes conventional activated sludge. Generic municipal or pharma MBR references consistently understate this loading because the substrates behave differently: residual proteins and polysaccharides drive rapid biofilm growth, silicone antifoam suppresses oxygen transfer, and mycelial fragments form mat-like structures that blind clarifiers within hours. Fermenter bleed streams can also leave the wastewater at 30-55°C with pH swinging between 4.5 and 9.0 over a single production cycle, which complicates any biology that has not been specifically acclimated.
Enzyme plant effluent is the composite of four distinct streams: (1) fermentation broth residual with high BOD, residual sugars, and 1,500-4,000 mg/L TSS of biomass and mycelium; (2) CIP washwater carrying NaOH 1-3% and H₃PO₄ 0.5-1.5% with periodic temperature spikes above 70°C; (3) extraction solvent residues from downstream separation (typically <50 mg/L but toxic to biomass); and (4) utility water — low load, but hot (45-60°C) and large in volume. The combined stream typically lands in the envelope below.
| Parameter | Typical Range | Notes |
|---|---|---|
| COD | 8,000-25,000 mg/L | Higher when fermenter bleed dominates the stream |
| BOD₅ | 4,000-15,000 mg/L | BOD/COD ratio 0.45-0.6 indicates good biodegradability |
| NH₃-N | 400-1,200 mg/L | Driven by yeast extract and protein hydrolysate residuals |
| TSS | 1,500-4,000 mg/L | Includes intact mycelial fragments and cell debris |
| FOG | 100-600 mg/L | Antifoam agents and lipid residues from fermentation |
| pH | 4.5-9.0 | CIP swings can reach pH 11+ without equalization |
| Temperature | 30-55°C | Direct fermenter bleed elevates mixed liquor temperature |
The fungal dimension is often overlooked. qPCR work on full-scale MBRs (Maza-Márquez et al.) showed that temperature is the dominant driver of fungal population dynamics in MBR mixed liquor, and lower SRT correlates with reduced biomass accumulation. Enzyme wastewater arrives pre-loaded with fungal biomass from Aspergillus, Trichoderma, and Bacillus production strains — exactly the population MBR must manage. For context on how these parameters map against other fermentation-derived streams, the amino acid fermentation wastewater treatment guide provides a directly comparable influent envelope.
Pre-Treatment Requirements Before an MBR
Feeding raw fermentation effluent directly into an MBR is the single most common cause of premature membrane failure in enzyme plants. The membrane does not tolerate pH excursions below 6.0 or above 8.5, temperatures above 38-40°C, intact mycelial mats, or free antifoam emulsions — all of which arrive in raw effluent. A staged pre-treatment train is mandatory, not optional.
Equalization. An equalization basin sized for 8-12 hours HRT smooths CIP-driven pH and temperature spikes. Target mixed liquor feed to the MBR at pH 6.5-8.0 and temperature <38°C. Without equalization, the MBR will see temperature transients that suppress mesophilic biology within minutes of a fermenter drain. A well-mixed EQ basin with a submerged mixer and aeration also drives off CO₂ and stabilizes pH ahead of neutralization.
Coarse screening. A rotary bar screen at 2-3 mm aperture is the first mechanical step. Mycelial mats from Aspergillus fermentations form rope-like aggregates that wrap around impellers and bridge across fine screens; a 2 mm bar aperture captures the bulk of these without excessive head loss. Anything finer than 1 mm is unnecessary and creates blinding.
FOG and antifoam removal. When influent FOG exceeds 200 mg/L, a DAF pre-treatment system is the correct choice. DAF reliably removes 85-95% of free oil and floating biomass when operated at 40-55% recycle ratio and 5-7 mg/L of cationic polyacrylamide. Below 200 mg/L FOG, a high-efficiency sedimentation tank (lamella) is more economical and removes 60-75% of residual TSS.
Pre-acidification. For influent COD above 18,000 mg/L or BOD/COD below 0.4, a 6-10 hour pre-acidification stage improves downstream MBR kinetics by converting complex polysaccharides and proteins to volatile fatty acids. HRT in this step should be tuned to 1.0-1.5 kg COD/m³·day loading.
MBR Process Selection: Single-Stage Aerobic vs Anaerobic + MBR Polishing
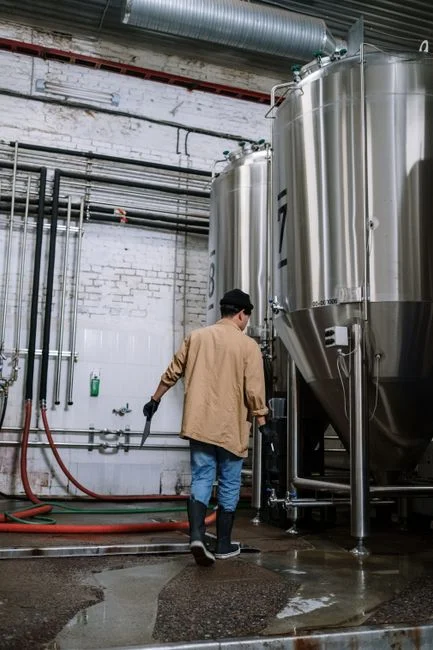
The central engineering decision for an enzyme plant MBR is whether to run a single-stage aerobic MBR or to add an anaerobic UASB upstream. The choice is not preference — it is driven by influent COD, available footprint, and whether biogas recovery justifies the higher capital cost. Below is the decision framework that has held up across HydropureWater field installations from 2022-2026.
Single-stage aerobic MBR. This is the right answer when influent COD is below 12,000 mg/L and flow is below 500 m³/day. Design HRT 18-30 hours, MLSS 8,000-12,000 mg/L, SRT 30-60 days. Aerobic MBR on enzyme effluent consistently achieves 92-97% COD removal (consistent with pharma MBR data reported by Springer 2020), NH₃-N removal above 95% once nitrification is established, and effluent turbidity below 1 NTU. The trade-off is energy: 0.45-0.65 kWh/m³ for aeration alone, with membrane scouring adding another 0.05-0.10 kWh/m³.
Anaerobic UASB + MBR polishing. This configuration is the right answer when influent COD exceeds 12,000 mg/L, the plant has a continuous heat demand for biogas utilization, or the operator is targeting the lowest possible OPEX. UASB at 35-37°C with 6-10 kg COD/m³·day organic loading achieves 60-75% COD reduction and a biogas yield of 0.30-0.45 m³/kg COD at 60-70% methane content. The downstream MBR polishes residual COD to below 300 mg/L and handles the TSS that anaerobic effluents always carry.
| Design Parameter | Single-Stage Aerobic MBR | Anaerobic UASB + MBR |
|---|---|---|
| Influent COD range | <12,000 mg/L | 12,000-25,000 mg/L |
| HRT (aerobic stage) | 18-30 hours | 8-14 hours |
| MLSS | 8,000-12,000 mg/L | 6,000-9,000 mg/L |
| SRT | 30-60 days | 25-40 days |
| COD removal overall | 92-97% | 95-98% |
| Aeration energy | 0.45-0.65 kWh/m³ | 0.25-0.40 kWh/m³ |
| Biogas offset | None | 0.8-1.2 kWh/m³ equivalent |
| Footprint (200 m³/day) | ~120 m² | ~180 m² (UASB + MBR) |
The footprint advantage of MBR over conventional activated sludge is real — an integrated MBR wastewater treatment system occupies roughly 60% less floor area than CAS at equivalent loading. The 200 m³/day example above assumes UASB at 8 m × 8 m plus MBR tank at 6 m × 5 m. Energy: anaerobic + MBR cuts net aeration energy by 35-50% and the biogas offset further reduces the plant's net energy import by 0.8-1.2 kWh/m³ treated.
Membrane Module Selection: PVDF Flat-Sheet vs Hollow-Fiber for Enzyme Effluent
For enzyme wastewater, the membrane module decision is more consequential than for municipal MBR. Hollow-fiber has higher packing density (more m²/m³) and lower capex per unit area, but mycelial strands and antifoam emulsions are exactly the fouling agents that hollow-fiber handles poorly — they lodge in the fiber bundle and are not removed by backwash. PVDF flat-sheet modules are the safer choice for enzyme effluent. Pore size should be 0.1-0.4 μm: below 0.1 μm flux collapses unacceptably under MLSS of 8,000-12,000 mg/L, and above 0.4 μm TSS breakthrough causes downstream RO membrane fouling when reuse is the target.
Flat-sheet PVDF (DF series). Individually replaceable elements, 0.1 μm nominal pore, output 32-135 m³/day per unit depending on module size, and 10-20× lower energy than cross-flow configurations because permeate is drawn by vacuum rather than pumped through the membrane. The PVDF flat-sheet MBR module is the standard recommendation for enzyme effluent where mycelial debris is unavoidable. Flat-sheet geometry also allows visual inspection of fouling without dismantling the rack — operators can see the cake layer and decide whether CIP is required.
Hollow-fiber. Higher m²/m³ packing, but vulnerable to irreversible fouling from antifoam and mycelial strands. Hollow-fiber MBR on enzyme effluent typically needs CIP every 2-3 weeks instead of every 4-6 weeks, and fiber replacement is more frequent. Acceptable for the polishing stage of an anaerobic + MBR configuration where the influent has already been clarified anaerobically.
| Selection Criterion | PVDF Flat-Sheet | Hollow-Fiber |
|---|---|---|
| Mycelial tolerance | High (open channel) | Moderate (fiber clogging) |
| Antifoam tolerance | High | Low-moderate |
| Packing density | Moderate | High |
| CIP frequency (enzyme effluent) | Every 4-6 weeks | Every 2-3 weeks |
| Element replaceability | Individual | Rack-level |
| Energy per m³ permeate | 0.10-0.20 kWh/m³ | 0.20-0.35 kWh/m³ |
CIP protocol for enzyme effluent. Weekly alkaline wash with NaOCl 1,000-2,000 mg/L at 30-35°C, 30-minute soak, followed by 20 minutes of forward flush. Monthly acid wash with citric acid 2% (pH 2.0-2.5) to remove inorganic scaling and antifoam residues. Expected flux recovery 85-95% with this protocol. Membrane scouring air demand for flat-sheet modules is 0.10-0.15 Nm³/m²·h — the integrated aeration box below the membrane stack delivers the coarse-bubble flow that keeps the cake layer from consolidating.
Effluent Quality Targets and Reuse Opportunities
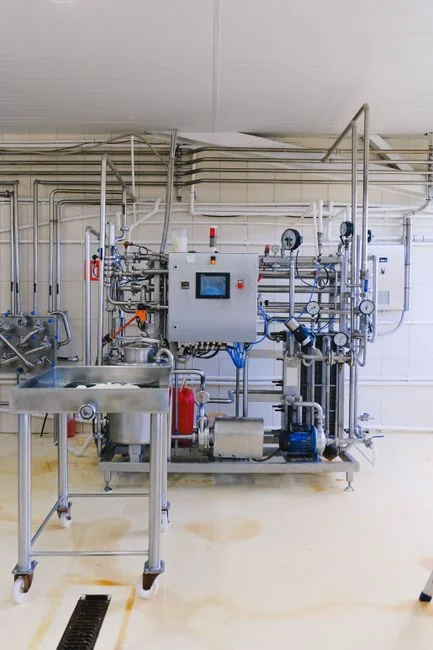
MBR effluent from a properly operated enzyme plant trains to a tight band. Discharge-quality effluent typically lands at COD 50-300 mg/L, BOD below 20 mg/L, NH₃-N below 5 mg/L with downstream nitrification configured, TSS below 5 mg/L, and turbidity below 1 NTU. This meets the pretreatment discharge limits of most municipal ordinances (COD <500 mg/L, SS <400 mg/L typical in EU and US).
Where the economics get interesting is reuse. An MBR + RO polishing train can take the MBR permeate to conductivity below 50 μS/cm and recover 60-75% of the stream as reusable process water for CIP, cooling tower makeup, or boiler feed. The RO polishing system in this configuration typically operates at 75-85% recovery per stage, with anti-scalant dosing to manage silica carryover from the antifoam. Sludge management is the second economic lever: MBR waste sludge production runs 0.15-0.25 kg TSS per kg COD removed, which is 60% lower than CAS — and a plate-frame filter press dewatering the waste sludge to 22-28% dry solids dramatically reduces disposal tonnage and cost.
2026 CAPEX and OPEX Benchmarks for Enzyme Plant MBR Systems
Cost data for industrial MBR on fermentation effluent is not publicly aggregated, so the ranges below are drawn from HydropureWater project installations completed between 2023 and 2026, normalized to a mid-2026 turnkey basis. They are banded, not point estimates, and they assume a pre-treatment train as described above.
CAPEX. Integrated MBR systems at 100-500 m³/day capacity fall in the $180,000-$850,000 turnkey range in 2026. The wide band is driven by pre-treatment inclusion (adds 20-35% to the base cost), automation scope (PLC vs full SCADA adds $40,000-$120,000), and membrane area (PVDF flat-sheet at current PVDF resin pricing runs $80-$140 per m² installed). Anaerobic + MBR hybrid configurations carry 18-25% higher CAPEX than single-stage aerobic at the same flow, primarily from the UASB reactor and gas-handling package.
OPEX. $0.18-$0.42 per m³ treated, dominated by aeration energy (45-55% of OPEX), membrane replacement on a 5-7 year cycle (15-20%), and CIP chemicals (8-12%). For an anaerobic + MBR hybrid at influent COD above 15,000 mg/L, the biogas yield at $0.08-$0.12/kWh thermal equivalent delivers a payback of 2.5-4 years versus single-stage aerobic, accounting for the higher upfront cost. As a baseline for comparison, the SBR reference pricing for hotel and casual wastewater is $90-$380 per m³ CAPEX — substantially below enzyme MBR because the loading is an order of magnitude lower (per the SBR hotel wastewater cost guide). For ongoing operating cost components, the RO membrane spare parts cost guide provides the consumable-side numbers for the downstream RO polishing stage.
| Cost Element | Single-Stage Aerobic MBR | Anaerobic + MBR Hybrid |
|---|---|---|
| CAPEX (200 m³/day, turnkey 2026) | $420,000-$620,000 | $520,000-$780,000 |
| OPEX (per m³ treated) | $0.28-$0.42 | $0.18-$0.30 |
| Aeration energy (per m³) | 0.45-0.65 kWh | 0.25-0.40 kWh |
| Biogas offset (per m³) | None | 0.8-1.2 kWh equiv. |
| Membrane replacement cycle | 5-7 years | 5-7 years |
| Payback vs single-stage | Baseline | 2.5-4 years (COD >15,000 mg/L) |
Frequently Asked Questions
What pore size PVDF membrane works best for enzyme wastewater? 0.1-0.4 μm. Below 0.1 μm flux drops below 8 LMH at typical MLSS; above 0.4 μm TSS breakthrough fouls downstream RO. Most enzyme plant installations settle on 0.1-0.2 μm flat-sheet PVDF.
How often should membranes be CIP-cleaned on fermentation effluent? Weekly alkaline (NaOCl 1,000-2,000 mg/L, 30 min) plus monthly acid (citric acid 2%, pH 2.0-2.5). Flux recovery should be 85-95% per cycle. If recovery falls below 75%, increase alkaline frequency to twice weekly.
Can MBR effluent meet EU and US reuse standards for enzyme plant operations? MBR alone meets typical municipal discharge pretreatment (COD <500 mg/L per most ordinances). For on-site reuse in CIP or cooling tower makeup, an MBR + RO polishing train achieves conductivity <50 μS/cm, suitable for boiler feed at moderate pressure.
What is the realistic SRT range for enzyme wastewater MBR? 25-60 days depending on configuration. Anaerobic + MBR polishing typically runs 25-40 days; single-stage aerobic MBR runs 30-60 days. SRT below 20 days risks washout of nitrifiers given influent NH₃-N of 400-1,200 mg/L.
Does mycelial biomass require special handling in MBR design? Yes. Pre-treatment must include 2-3 mm screening to remove intact mats, and membrane scouring air should be 0.10-0.15 Nm³/m²·h to prevent cake consolidation. Flat-sheet PVDF outperforms hollow-fiber on mycelial effluent by a factor of 2-3× in CIP frequency.