Why Plants Specify Oil and Grease Online Monitoring
Oil and grease online monitoring gives a continuous oil-in-water reading so plants can dose, skim, or divert before a non-compliant batch leaves the site. EPA Method 1664 grabs take 24–48 hours to return. A 15–30 minute oil slug can pass between grabs and foul UV banks. Sensor loops to dose and skimming cut oil-related excursions by 70–90% (Poseidon Systems, 2026-01).
A single missed oil excursion at a food or metalworking plant now costs between $30,000 and $80,000 once cleanup, agency penalties, and lost production are tallied (per US EPA enforcement summaries, 2025). The failure mode is the same in almost every plant post-mortem. Emulsified oil leaves a wash cycle, rides through flotation between grabs, and triggers a Notice of Violation about 48 hours later. Continuous trend visibility on the wastewater stream—not lubricant-condition monitoring—is now a procurement priority for plants with a discharge permit.
How Online Oil & Grease Sensors Actually Measure Oil in Water
Four physical principles dominate the in-pipe oil-in-water analyzer market for wastewater-effluent duty. Specifying the right class starts with knowing what the stream actually contains, not with brochure peak resolution.
UV fluorescence sensors excite aromatic hydrocarbons at roughly 254 nm and measure re-emission near 350 nm. They are the workhorse for trace dissolved or finely emulsified oil in the 0.1–10 ppm range. That band is exactly what a post-DAF polishing step has to verify. Infrared absorption at the 3.4 µm C–H stretch band maps most directly onto EPA Method 1664's n-hexane extractable principle. It covers 1–200 ppm and suits refinery desalter effluent, but the optics drive CAPEX 2–3× higher than fluorescence.
Scattered-light and laser-induced particle counters detect droplets above about 1 µm. They handle raw in-plant streams from 50–2,000 ppm and fit upstream metalworking coolant, but they are blind to dissolved oil below its aqueous solubility. Capacitance and microwave sensors respond to oil-in-water emulsion regardless of droplet size and are mechanically rugged. They still drift in high-TDS streams because ionic strength shifts the baseline, so brine or pickle-line service needs frequent calibration.
Response time is the other separator. Fluorescence and IR return a usable reading in under 30 seconds; capacitance typically averages over 1–5 minutes. For a DAF dose-control loop the fast classes are mandatory. For a mass-balance log on the skimmer line the slower classes are acceptable. Most plants we size for food or metalworking duty run at the lower end of the stated range once emulsifiers and temperature are accounted for. The engineering rule: match the sensor to the stream, not to the most expensive brochure.
| Principle | Detection Band | Response Time | Sees Dissolved Oil? | Sees Free Oil Droplets? | Relative CAPEX |
|---|---|---|---|---|---|
| UV fluorescence (~254 nm ex / ~350 nm em) | 0.1–10 ppm | <30 s | Yes | Partially | $ |
| IR absorption (3.4 µm C–H stretch) | 1–200 ppm | <30 s | Yes | Yes | $$$ |
| Scattered-light / particle counter | 50–2,000 ppm | <60 s | No | Yes (>1 µm) | $$ |
| Capacitance / microwave | 100–5,000 ppm | 1–5 min | Yes | Yes | $$ |
What Is Realtime Oil/Grease Monitoring in Wastewater?
Realtime oil/grease monitoring in wastewater means a continuous in-pipe analyzer returns a usable oil-in-water reading in under 30 seconds to five minutes. That signal drives dose, skim, or divert logic before a non-compliant batch leaves the plant. Unlike Method 1664 grabs, the loop acts on the same shift the excursion starts. Plants that only log daily averages still miss the 15–30 minute slug that drives most Notices of Violation.
For dose actuation the fast fluorescence and IR classes are preferred. Capacitance remains useful when droplet size is unknown and operators mainly need a rugged mass-balance trend rather than a sub-ppm compliance gate.
Where the Sensor Sits on a DAF or Separator Loop
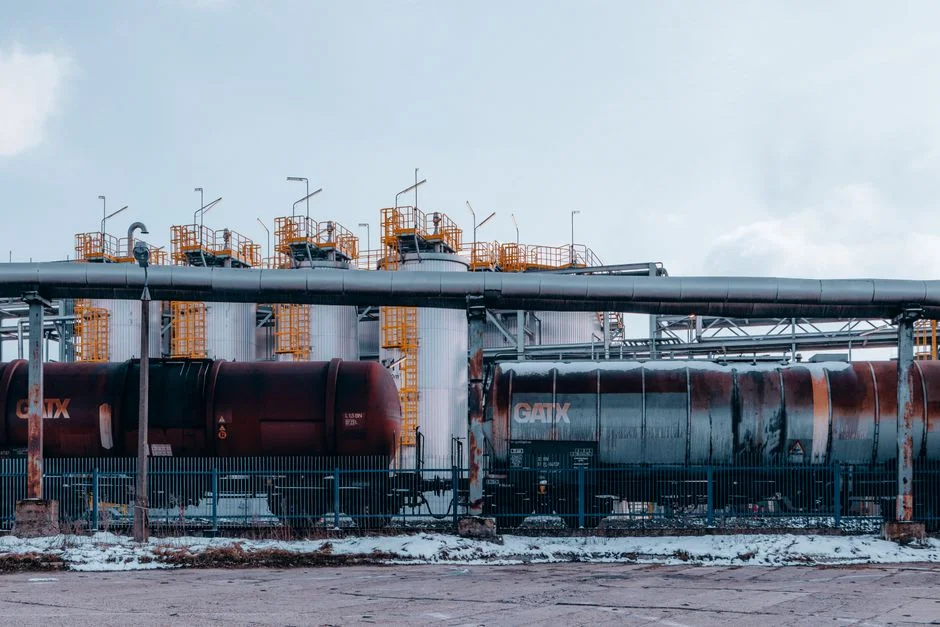
Sensor placement determines whether an oil-in-water analyzer project earns its keep or becomes an expensive paperweight. A pre-DAF installation protects the flotation unit from shock loads and closes a real control loop. The 4–20 mA signal feeds a chemical dosing pump that adjusts coagulant and polymer feed with the incoming hydrocarbon load, typically cutting polymer consumption 10–20% (HydropureWater field data, 2025).
A post-DAF, pre-discharge installation is the compliance verification point. The reading is compared against 80% of the permit limit. An alarm plus a diversion valve then routes non-conforming flow to a slop tank before it leaves the site. A third useful location is in the skimmer sludge line, where the sensor gives operators a recovered-oil mass figure that closes the daily mass balance and supports FOG reporting.
On the host side, the Dissolved Air Flotation (DAF) System covers 4–300 m³/h across 13 models with automatic skimming, and its PLC accepts a 4–20 mA or Modbus TCP input directly. For dose actuation, the automatic chemical dosing system takes the same analog signal and modulates pump stroke to track setpoint. Sample conditioning is non-negotiable on food and metalworking streams. A 50 µm Y-strainer upstream of the optical cell keeps fat, fiber, and metal fines out of the measurement window. Most 2026-vintage optical cells now ship with an air-purge nozzle or a wiper that drops manual cleaning to a monthly task.
Matching Sensor Class to Stream Type: Selection Matrix
Correct sensor selection prevents the common error of over-specifying refinery-class hardware for food plants or under-specifying turbidity sensors for dissolved-oil polishing. The matrix below maps stream type to sensor class with the CAPEX and OPEX envelopes for procurement.
| Stream Type | Recommended Sensor | Range | Detection Limit | Response Time | CAPEX (skidded) | 5-yr OPEX (est.) |
|---|---|---|---|---|---|---|
| Food processing / dairy / edible oil post-DAF | UV fluorescence | 0.1–10 ppm | 0.05 ppm | <30 s | $18K–$35K | $6K–$10K |
| Metalworking / machining coolant pre-DAF | Scattered-light or capacitance | 10–2,000 ppm | 5 ppm | <60 s / 1–5 min | $12K–$22K | $4K–$7K |
| Petrochemical / refinery desalter post-DAF | IR absorption (3.4 µm) | 1–200 ppm | 0.5 ppm | <30 s | $40K–$75K | $12K–$18K |
| Refrigerated / oily condensate | UV fluorescence | 0.1–5 ppm | 0.05 ppm | <30 s | $20K–$30K | $5K–$8K |
All four classes now ship with auto-cleaning wiper or air-purge nozzle as standard in 2026. That change collapses weekly manual wipe-downs into monthly checks and lowers OPEX (Poseidon Systems, 2026-01). For plants running two or more DAF units, a stream-switching multiplexer lets one analyzer cover 2–4 streams on a 10-minute rotation, cutting per-stream CAPEX by roughly 40%.
Which sensor class fits a post-DAF polishing stream?
Post-DAF polishing streams almost always need UV fluorescence in the 0.1–10 ppm band when the permit limit sits near 5–15 mg/L oil and grease. IR absorption remains the better fit when the stream is aromatic-rich refinery desalter water and Method 1664 alignment matters more than CAPEX. Scattered-light counters belong upstream of flotation, not on the final effluent header.
Compliance Linkage: Oil & Grease Discharge Limits
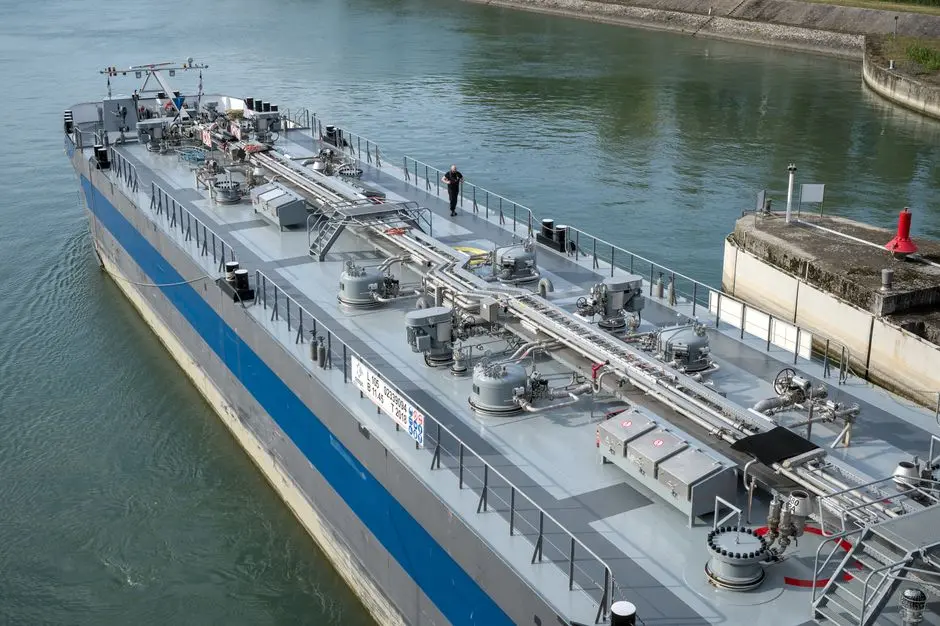
Online monitoring is most effective when tied directly to permit limits. The four most relevant regulatory frames for an industrial wastewater engineer are summarized below. Broader NPDES reporting context is covered in the wastewater self-monitoring reporting requirements guide and the 2026 total nitrogen compliance guide for parallel nutrient limits on the same discharge.
| Jurisdiction | Oil & Grease Limit | Reference Method | Notes |
|---|---|---|---|
| United States (NPDES, categorical) | 5–15 mg/L (typical categorical range) | EPA Method 1664 (n-Hexane Extractable Material) | Daily max, varies by industry category |
| European Union | Source removal required; UWWTD 2024/3019 + IED 2010/75/EU | EN 1484 / national equivalents | Mandatory oil/grease removal >1 m³/day discharges |
| China (GB 8978-1996) | 10 / 20 / 30 mg/L (Class I / II / III) | HJ 637-2018 (IR) or gravimetric | Class I is binding for industrial park first-stage discharge |
| Saudi Arabia (PME / NCEC) | 15 mg/L | APHA 5520 B/C equivalents | Industrial wastewater discharge to TSE |
Set the alarm at about 80% of the daily maximum so operators divert flow before the permit limit is crossed. Pair that gate with a documented grab-sample program so the continuous trend and Method 1664 remain legally connected.
ROI, CAPEX, and Payback: The Buyer's Math
The following data from a working procurement memo covers the plant-size scenarios most frequently encountered in industrial settings. Oil and grease online monitoring payback is driven by avoided excursions, polymer savings, and labor reallocation—not by the sensor sticker price alone—and often falls in the 12–24 months band across plant sizes.
| Plant Size | CAPEX (sensor + install) | Primary Savings | Payback |
|---|---|---|---|
| Small (50–150 m³/h) | $28K ($20K + $8K install) | Replaces ~1 hr/day manual sampling; $25K/yr labor | ~14 months |
| Mid (150–500 m³/h) | $47K ($35K + $12K install) | 10–20% polymer savings via polymer dose optimization strategies + avoided excursions | 18–24 months |
| Large (500+ m³/h) | $60K–$90K skidded with dual-stream multiplexer | One avoided excursion ($30K–$80K per EPA summaries) covers CAPEX | 12–18 months |
The soft line item is labor. Continuous monitoring reallocates roughly one FTE from grab sampling to process optimization. That mirrors the maintenance-strategy savings logic Poseidon Systems applies to rotating-equipment oil-condition monitoring (2026-01). Applied to a wastewater stream, the savings come from dose optimization rather than oil-change intervals, but the procurement argument is structurally identical.
Selection checklist before you buy: confirm permit limit and units (mg/L vs ppm). Map free vs dissolved vs emulsified oil, then pick pre-DAF, post-DAF, or skimmer location. Require 4–20 mA or Modbus into the existing PLC, plus a 50 µm sample strainer and auto-clean. Budget 5-year OPEX for calibration standards and wiper parts, and decide whether a multiplexer can cover multiple trains.
Who this is for: food, metalworking, petrochemical, and condensate plants that already run DAF or API separators and need continuous oil-in-water visibility tied to dose or diversion. Who should look elsewhere: sites whose only need is quarterly Method 1664 compliance with no process control loop, or lubricant-condition programs on rotating equipment rather than wastewater effluent. Next step: send influent/effluent oil range, permit limit, and DAF model with your monitoring and DAF integration inquiry so the loop can be sized against the real stream.
Frequently Asked Questions
What detection range do I need for post-DAF effluent?
For post-DAF final effluent, 0.1–10 ppm UV fluorescence is the right band when the permit sits near 5–15 mg/L oil and grease. That range covers typical polishing duty with a detection limit near 0.05 ppm. Choose IR absorption at 1–200 ppm instead when Method 1664 alignment on aromatic-rich refinery water matters more than CAPEX. Scattered-light counters above 50 ppm belong on raw plant drains, not on the discharge header.
Can one analyzer cover more than one DAF train?
Yes. A stream-switching multiplexer can rotate one analyzer across 2–4 streams on a 10-minute cycle and cut per-stream CAPEX by roughly 40%. Keep sample lines short and flushed so residual oil from one train does not bias the next reading. Dual-stream skidded packages in the $60K–$90K band are common on large plants above 500 m³/h.
Where should the sensor sit relative to the DAF?
Pre-DAF placement closes a dose-control loop and can cut polymer use 10–20% when the 4–20 mA signal drives coagulant and polymer pumps. Post-DAF placement is the compliance gate: alarm near 80% of the permit limit and divert non-conforming flow to a slop tank. A skimmer-line sensor closes the recovered-oil mass balance for FOG reporting.
How fast must the reading be for dose control?
DAF dose-control loops need fluorescence or IR readings available in under 30 seconds so the chemical pumps track the hydrocarbon load in the same hydraulic residence window. Capacitance averages of 1–5 minutes are acceptable for skimmer mass-balance logging but too slow for tight polymer trim. Match response time to the control objective, not to a single vendor claim.
Does continuous monitoring replace EPA Method 1664 grabs?
No. Continuous oil-in-water analyzers provide operational trend and diversion logic; Method 1664 remains the reference method for many NPDES categorical limits. Keep scheduled grabs for permit reporting and use the online signal to prevent the excursion that the lab would only discover 24–48 hours later. Tie both data streams in the plant's self-monitoring file.