Why Polymer Is the Most Leveraged Chemical in Your OPEX Stack
Polymer flocculants are typically the single largest discretionary chemical line in an industrial or municipal wastewater plant. Dry cationic polyacrylamide (CPAM) runs $3.50–$6.50/kg in 2024–2025 industrial commodity benchmarks; emulsion polymers sit at $4.00–$7.50/kg; anionic grades (APAM) are 10–15% cheaper. Dose rates swing widely by application: tertiary clarification typically takes 1–15 g/m³, while belt-press or filter-press sludge dewatering demands 3–8 kg per ton of dry solids (per the JSDEWES Finland case study, 2024).
Run the math on a 10,000 m³/day plant dosing 5 g/m³ of dry CPAM at $5.00/kg: annual polymer spend lands at roughly $91,000. At the upper dose band (8 g/m³) and upper price ($6.50/kg), the same plant burns $190,000/year. Most industrial operations can realistically recover 20–40% of that — $13,000–$48,000/year in direct chemical spend, plus secondary gains from higher cake solids (less hauling) and cleaner clarifier overflow (less downstream membrane fouling). For a procurement lead building a 2026 capex case, polymer is where the marginal dollar buys the most avoided cost.
The Flocculation Mechanism Behind Every Polymer Decision
Two mechanisms govern polymer performance, and identifying the dominant process in your stream is essential for setting a defensible dose. Charge neutralization dominates when the target is colloidal destabilization — a high-charge-density cationic polymer collapsing the negative zeta potential of fine suspended colloids. Bridging flocculation dominates for larger particles and for sludge conditioning, where a high-molecular-weight polymer (8–18 g/mol, often anionic or cationic) physically links particles into settleable or floatable flocs.
"More is better" is the most expensive mistake in polymer programs. Overdose restabilizes colloids (the polymer surface recharges positive), produces watery flocs that settle slowly, blinds filter cloth, and in dewatering can actually drop cake solids by 2–4 percentage points because excess polymer holds water in the cake. The 2024 JSDEWES Finland study confirmed that optimal polymer dose tracks influent particle concentration in real time rather than a fixed setpoint on a calendar.
Four Levers That Actually Move Polymer Consumption Down
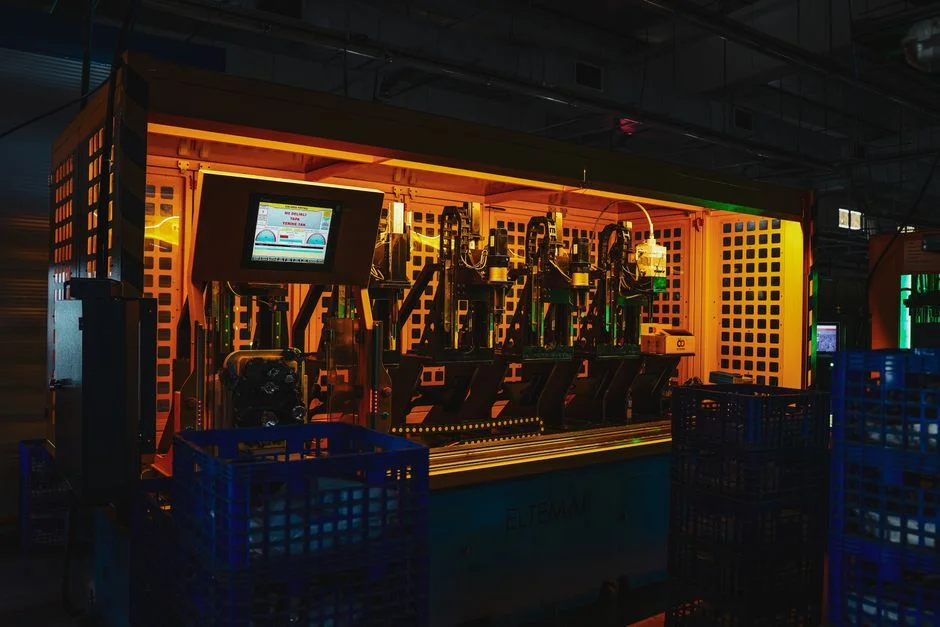
Optimizing polymer spend requires a multi-lever approach, as most plants currently focus on only one. Plants without influent characterization typically overdose 30–60% because the dose is set against the worst expected influent, not the actual one. Lever 1 — Influent characterization: weekly TSS, COD, and zeta potential trending; without it, dose defaults to the maximum historical requirement. Lever 2 — Polymer selection: match charge density and molecular weight to the application — low-charge, high-MW for bridging in sludge; high-charge, medium-MW for colloidal clarification. Lever 3 — Preparation quality: 30–60 min maturation for dry polymer, 5–15 min for emulsion, at 0.05–0.2% w/w concentration. Lever 4 — In-line dose control: streaming-current detector or optical TSS sensor closing a PID loop on a PLC-controlled polymer dosing skid — the Finland study proved 0.030 mg/mL achievable versus 0.1–1.3 mg/L under static dosing.
| Lever | Typical Polymer Savings | Indicative Capex (USD) | Payback (months) |
|---|---|---|---|
| 1. Influent characterization program | 10–20% | $3,000–$8,000 (instrumentation) | 1–3 |
| 2. Polymer selection / grade change | 5–15% | Jar-test bench, ~$1,500 | <1 |
| 3. Preparation (maturation + concentration) | 5–10% | $5,000–$15,000 (mixing train) | 2–6 |
| 4. In-line dose control (streaming current / TSS) | 15–30% | $20,000–$35,000 (skid + sensor) | 4–10 |
Lever 4 provides the largest absolute savings, but it requires Lever 1 to be in place because a PID loop on a noisy, uncharacterized influent is ineffective. For a deeper look at the sensing layer, see the edge computing for in-line wastewater monitoring engineering guide.
Equipment Upgrades That Pull Polymer Demand Down Indirectly
Hardware improvements reduce the polymer load a stream presents by increasing physical separation efficiency. A lamella clarifier retrofit (inclined-plate pack, 20–40 m/h surface loading rate) reduces combined coagulant + flocculant demand by up to 30% versus a conventional rectangular clarifier, because the higher effective settling area captures more particles per unit of floc strength (HydropureWater field data, 2026). A high-efficiency DAF flotation unit with microbubble aeration in the 20–50 µm range produces denser float solids, so the same floc strength is achieved with 20–30% less polymer than a coarse-bubble DAF — a meaningful lever for any food or textile plant; the DAF operating cost breakdown for 2026 shows polymer as 35–55% of DAF OPEX.
Downstream, a plate-and-frame filter press operating at 6–10 bar with properly conditioned sludge reaches 22–28% cake solids. Over-conditioned sludge — visually dry on the press, but loaded with unreacted polymer — wastes chemical with no dewatering benefit. The filter press pricing and polymer cost guide walks through how to right-size polymer dose against cake target. Overdosed polymer upstream carries into downstream UF/MF and fouls RO membranes, so the savings of "a little extra" can quietly turn into an expensive CIP cycle.
A 12-Month Polymer Optimization Roadmap
Phasing these improvements ensures accurate performance tracking and maintains operational stability.
- Months 1–2 — Baseline. Log dose, polymer grade, influent TSS/COD, and clarified TSS for 4 weeks; calculate $/m³ baseline and $/ton dry solids dewatered.
- Months 3–4 — Jar tests. Bracket the true optimum for each shift and each season (cold vs. warm, weekday vs. weekend).
- Months 5–7 — Install automatic dosing. Bring a PLC-controlled polymer dosing skid online with a streaming-current or optical TSS sensor in the PID loop.
- Months 8–10 — Tune to seasonal swings. Re-jar-test quarterly; re-evaluate polymer grade if influent character shifts more than 15%.
- Months 11–12 — Lock and report. Convert the working setpoints into SOPs; deliver the cumulative $/year savings to the CFO and EHS.
The first two phases are essentially free, while the capex hits in month 5 and is typically recovered before the end of month 12.
Worked Example: $32,000/Year Saved on a 5,000 m³/day Food Plant
A 5,000 m³/day fruit-and-vegetable processing plant currently dosing 6 g/m³ of dry CPAM at $4.50/kg, dewatering on a belt filter press with 20% hauling moisture, serves as a representative case. Annual polymer cost: 5,000 × 6 × 365 ÷ 1,000 × $4.50 = $49,275. The plant installs a PLC-controlled polymer dosing skid with an in-line TSS sensor and a lamella clarifier retrofit ahead of the DAF. After four months of tuning, dose settles at 3.8 g/m³ (≈37% reduction), and cake solids climb from 18% to 22%.
| Line Item | Baseline | Post-Optimization | Annual Delta |
|---|---|---|---|
| Polymer dose | 6 g/m³ | 3.8 g/m³ | — |
| Polymer spend | $49,275 | $31,200 | +$18,075 |
| Sludge hauling (assumed 1,200 wet tons/yr at $65/ton) | $78,000 | $64,350 | +$13,650 |
| Net annual savings | — | — | ~$31,700 |
| Capex (skid + sensor + lamella work) | — | ~$28,000 | — |
| Simple payback | — | — | ~10.6 months |
That $31,700/yr is a defensible, citable number for a capex committee — and it scales roughly linearly with flow, so a 20,000 m³/day municipal works runs the same math and lands at $115,000–$130,000/yr saved on a $90,000–$110,000 capex.
Frequently Asked Questions
What is a typical polymer dose for DAF versus sludge dewatering in 2026? DAF air-flotation clarification typically takes 2–8 g/m³ of dry or emulsion polymer; belt-press and filter-press sludge dewatering takes 3–8 kg per ton of dry solids, with cake-solids target of 20–28% driving the upper end of the range (per HydropureWater field data, 2026).
How often should a plant re-jar-test its polymer dose? Quarterly is the practical minimum, and immediately after any influent shift of more than 15% in TSS or COD. A static jar-test result more than 90 days old should be treated as a guess, not a setpoint.
Is emulsion polymer cheaper to use than dry polymer in 2026? Per kilogram of active, emulsion is typically 15–30% more expensive than dry, but its 5–15 minute maturation versus 30–60 minutes for dry, plus lower energy for mixing, can flip the total OPEX picture in low-throughput plants. Always compare on $/m³ treated, not $/kg.
Can overdosing polymer harm downstream RO or UF membranes? Yes. Excess cationic polymer carries through clarification and DAF and fouls UF/RO surfaces, raising differential pressure 10–25% and shortening CIP intervals. If membrane delta-P drifts up while polymer dose has held steady, the polymer is the first place to look, not the membranes.