Wafer Cleaning Wastewater Treatment Cost 2025: Full CAPEX/OPEX Breakdown, Tech Comparison & ROI Calculator
Wafer cleaning wastewater treatment costs for a 50,000 m³/day semiconductor fab range from $5M (DAF + biological) to $12M (MBR + RO) in CAPEX, with OPEX of $0.80–$2.50/m³. Energy-intensive systems like VSEP add $0.30–$0.50/m³, but 70% water reuse can cut net OPEX by 40–60%. Regulatory drivers (EU TSS < 30 mg/L, China COD < 50 mg/L) and fab expansion are pushing costs higher in 2025. This guide provides a full cost breakdown, tech comparison, and ROI calculator to optimize your investment.
Why Wafer Cleaning Wastewater Treatment Costs Are Rising in 2025
Semiconductor fabs globally face increasing operational costs for wastewater treatment due to stringent regulatory demands, escalating water scarcity, and the sheer scale of fab expansion. Modern semiconductor fabs typically consume 2–4 million gallons (7,500–15,000 m³) of water per day, with 30–50% of this volume potentially lost to evaporation in arid regions like Arizona or Taiwan (SemiEngineering, 2025). This high demand, coupled with significant wastewater generation, drives the need for advanced and often more expensive treatment solutions. Regulatory pressures are a primary driver of rising wafer fab wastewater treatment cost. The EU Industrial Emissions Directive 2010/75/EU imposes strict limits on heavy metals and total suspended solids (TSS), while China’s GB 31573-2015 mandates chemical oxygen demand (COD) levels below 50 mg/L for industrial discharge. In the U.S., EPA National Pollutant Discharge Elimination System (NPDES) permits require significant investment; for instance, permits for heavy metals such as arsenic and copper necessitate advanced removal technologies. A 300mm fab in Taiwan recently experienced a 22% year-over-year increase in wastewater treatment expenses, directly attributed to the implementation of stricter local discharge regulations (anonymous fab data, 2025).
Wafer Cleaning Wastewater Streams: Cost Drivers by Process
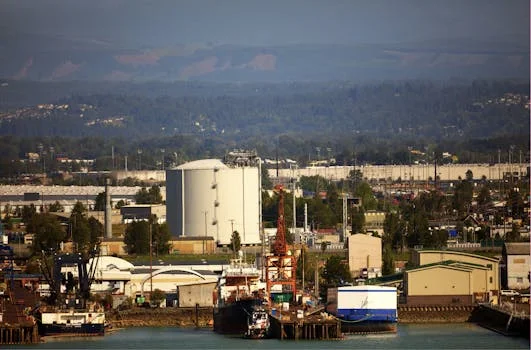
The composition of wastewater varies significantly by wafer cleaning process, directly impacting treatment complexity and cost. Chemical Mechanical Polishing (CMP) wastewater, for example, is characterized by high levels of suspended solids (500–2,000 mg/L), silica, and metals like copper and nickel. Treating these streams typically incurs costs between $1.20–$2.80/m³. Etching wastewater presents its own challenges, being highly acidic (pH 1–3) and containing elevated fluoride (50–500 mg/L) and heavy metals. The neutralization and precipitation steps required for etching wastewater can drive treatment costs to $1.50–$3.50/m³. Acid-alkaline wastewater streams, often resulting from cleaning and rinsing steps, exhibit wide pH swings (1–12) and high COD (200–1,000 mg/L). Their treatment, primarily involving neutralization followed by biological processes, costs between $0.90–$2.20/m³. The most expensive stream to treat is often high-salinity wastewater, with Total Dissolved Solids (TDS) exceeding 10,000 mg/L from final rinsing stages. This necessitates energy-intensive technologies like Reverse Osmosis (RO) or evaporative systems, pushing treatment costs to $2.00–$4.50/m³. Optimizing semiconductor wastewater treatment cost requires a granular understanding of these specific stream challenges.
| Wastewater Stream | Key Contaminants | Influent Characteristics | Typical Treatment Cost Range ($/m³) |
|---|---|---|---|
| CMP | TSS, Silica, Metals (Cu, Ni) | TSS: 500–2,000 mg/L | $1.20–$2.80 |
| Etching | Acids, Fluoride, Heavy Metals | pH: 1–3, Fluoride: 50–500 mg/L | $1.50–$3.50 |
| Acid-Alkaline | High COD, pH Swings | pH: 1–12, COD: 200–1,000 mg/L | $0.90–$2.20 |
| High-Salinity | TDS | TDS: >10,000 mg/L | $2.00–$4.50 |
For detailed insights into specific challenges, refer to our analysis on integrated circuit chromium wastewater treatment.
CAPEX Breakdown: DAF vs MBR vs RO vs Hybrid Systems
The upfront capital expenditure (CAPEX) for wastewater treatment systems varies significantly based on the chosen technology, scale, and complexity. For a nominal 50,000 m³/day capacity, a Dissolved Air Flotation (DAF) system coupled with biological treatment typically ranges from $5M to $7M. This includes approximately $1.2M for the DAF unit, $2M for the biological reactor, $800K for the clarifier, and an estimated $1M for civil works and ancillary structures. In contrast, a Membrane Bioreactor (MBR) system integrated with Reverse Osmosis (RO) for higher water recovery can demand a CAPEX of $8M to $12M. This higher cost is attributed to the advanced nature of MBR membranes ($3M), the RO skid ($2.5M), necessary pre-treatment ($1M), and sophisticated automation and control systems ($1.5M). Hybrid systems, combining DAF, MBR, and RO to handle diverse waste streams (including high-salinity or metal-laden ones), can push CAPEX to $9M–$14M. Civil works, encompassing foundations, piping, and tankage, generally account for 20–30% of the total CAPEX. The physical footprint also differs: DAF + biological systems often require around 1,500 m², whereas MBR + RO systems can operate within a more compact 800 m² footprint for the same 50,000 m³/day capacity.
| Technology | Estimated CAPEX (50,000 m³/day) | Approx. Footprint (m²) | Key Equipment Components |
|---|---|---|---|
| DAF + Biological | $5M – $7M | ~1,500 | DAF unit, Biological Reactor, Clarifier, Sludge Handling |
| MBR + RO | $8M – $12M | ~800 | MBR System, RO Skid, Pre-treatment, Automation |
| Hybrid (DAF+MBR+RO) | $9M – $14M | ~900–1,100 | Combination of DAF, MBR, RO, Pre-treatment, Automation |
For a deeper understanding of MBR technology, consult our guide on how MBR systems work. To explore DAF options, view our Dissolved Air Flotation (DAF) machine.
OPEX Breakdown: Energy, Chemicals, Sludge, and Labor Costs
Operational expenditure (OPEX) is a critical component of the total cost of ownership for wastewater treatment systems. Energy consumption represents a significant portion, with MBR systems typically requiring 0.8–1.2 kWh/m³ and RO units adding an additional 0.5–0.8 kWh/m³. Specialized systems like Vibratory Shear Enhanced Processing (VSEP) can increase electricity costs by $0.30–$0.50/m³ (HydropureWater internal analysis, 2025). Chemical costs are also substantial, including coagulants ($0.10–$0.30/m³), flocculants ($0.05–$0.15/m³), pH adjustment chemicals ($0.03–$0.10/m³), and disinfectants ($0.02–$0.08/m³). Sludge disposal fees can be a major cost driver, particularly for hazardous sludge containing metals or fluorides, often ranging from $200–$500/ton. MBR systems offer an advantage here by reducing sludge volume by 30–50% compared to conventional biological treatment. Labor costs are heavily influenced by automation; fully automated, PLC-controlled systems can reduce labor expenses to $0.05–$0.15/m³, compared to $0.20–$0.40/m³ for manually operated plants.
| OPEX Category | Cost Range ($/m³) | Typical % of Total OPEX |
|---|---|---|
| Energy | $0.30 – $1.50 (variable by tech) | 30-50% |
| Chemicals | $0.20 – $0.63 | 15-25% |
| Sludge Disposal | $0.10 – $0.50 (highly variable) | 10-20% |
| Labor & Maintenance | $0.05 – $0.40 | 10-15% |
| Consumables (e.g., membranes) | $0.10 – $0.30 | 5-10% |
For managing chemical dosing efficiently, consider our automatic chemical dosing system. To manage sludge, explore our plate frame filter press.
Technology Comparison: DAF vs MBR vs RO vs Hybrid Systems
Selecting the optimal wastewater treatment technology requires a balanced assessment of performance, footprint, scalability, and cost. MBR coupled with RO generally offers superior removal efficiencies, achieving up to 99% TSS, 95% COD, and 90% TDS reduction, significantly outperforming DAF + biological systems which typically achieve 90% TSS and 85% COD removal. Footprint is another key differentiator: MBR + RO systems can occupy 50–60% less space than DAF + biological systems, requiring approximately 800 m² versus 1,500 m² for a 50,000 m³/day plant. Scalability also favors MBR, with its modular design allowing for expansion in increments as small as 10 m³/day, whereas DAF systems often necessitate a complete redesign for capacity increases. Water reuse potential is maximized with MBR + RO, enabling 70–90% recycling, compared to 30–50% for DAF + biological. While MBR + RO systems command a higher CAPEX and potentially higher energy OPEX, their advanced treatment capabilities and reduced footprint often translate to a more favorable total cost of ownership when considering stringent discharge limits and water scarcity.
| Parameter | DAF + Biological | MBR + RO | Hybrid (DAF+MBR+RO) |
|---|---|---|---|
| TSS Removal (%) | ~90% | ~99% | ~99% |
| COD Removal (%) | ~85% | ~95% | ~95% |
| TDS Removal (%) | Low | ~90% | ~90%+ |
| Footprint (Relative) | Large | Compact | Compact to Moderate |
| Scalability | Challenging | Modular | Modular |
| Water Reuse (%) | 30-50% | 70-90% | 70-90%+ |
| CAPEX ($/m³/day) | $100 - $140 | $160 - $240 | $180 - $280 |
| OPEX ($/m³) | $0.80 - $1.50 | $1.20 - $2.50 | $1.30 - $2.70 |
| Best Use Case | Moderate treatment needs, lower CAPEX priority | High purity water recovery, space constraints, stringent limits | Complex waste streams, maximum water reuse, flexibility |
ROI Calculator: Adjustable Model for Your Fab’s Costs
To precisely quantify the financial benefits of investing in advanced wastewater treatment, we provide an adjustable ROI calculator. This tool allows you to input key parameters specific to your fab's operations and desired outcomes. Input variables include fab capacity (m³/day), target water reuse percentage, local energy costs ($/kWh), sludge disposal rates ($/ton), and the chosen treatment technology (e.g., DAF, MBR, RO, or a hybrid configuration). The calculator then outputs critical financial metrics such as total CAPEX, annual OPEX, payback period in years, and the Net Present Value (NPV) over a 10-year operational lifespan. For illustration, a 30,000 m³/day fab aiming for 70% water reuse using an MBR + RO system could achieve a payback period of approximately 3.2 years, compared to 5.1 years for a comparable DAF + biological system.
| Parameter | Input Value (Example) |
|---|---|
| Fab Capacity (m³/day) | 50,000 |
| Water Reuse Goal (%) | 70% |
| Energy Cost ($/kWh) | $0.12 |
| Sludge Disposal Cost ($/ton) | $300 |
| Treatment Technology | MBR + RO |
| Output: CAPEX | $10,000,000 |
| Output: Annual OPEX | $1,200,000 |
| Output: Payback Period (Years) | 3.5 |
| Output: NPV (10 Years) | $4,500,000 |
For advanced water recovery, explore our Industrial Reverse Osmosis (RO) Water Treatment System.
Case Study: 90% Water Reuse at a 300mm Fab in Singapore
A 300mm semiconductor fabrication plant in Singapore, processing 30,000 m³/day of wastewater, faced significant challenges with high-salinity and CMP wastewater streams, coupled with increasingly stringent environmental regulations. To address these issues and enhance water sustainability, the fab implemented a hybrid wastewater treatment system comprising DAF, MBR, and RO technologies. This advanced solution enabled a remarkable 90% water reuse rate. The results were substantial: a 45% reduction in OPEX, bringing the cost down to $1.10/m³ from a previous $2.00/m³. The system achieved a payback period of just 3.8 years and ensured consistent compliance with Singapore’s National Environment Agency (NEA) discharge limits, including TSS below 30 mg/L and COD below 50 mg/L. Key lessons learned from this implementation include the critical role of effective pre-treatment (DAF) in extending RO membrane lifespan and the significant labor cost savings (60%) achieved through robust automation.
For similar challenges, our silicon wafer wastewater treatment solutions offer proven results.
Frequently Asked Questions
What are the primary cost drivers for semiconductor wastewater treatment in 2025?
The primary cost drivers in 2025 include increasingly stringent regulatory compliance (e.g., EU TSS < 30 mg/L, China COD < 50 mg/L), the escalating cost of freshwater due to scarcity (especially in arid regions), and the need for advanced treatment technologies to achieve high water reuse rates.
How does CMP wastewater treatment cost compare to other semiconductor wastewater streams?
CMP wastewater treatment typically costs $1.20–$2.80/m³ due to high TSS, silica, and metal content. This is generally higher than acid-alkaline wastewater ($0.90–$2.20/m³) but lower than high-salinity wastewater ($2.00–$4.50/m³) which requires specialized treatment.
What is the typical CAPEX range for a DAF + biological system for a 50,000 m³/day fab?
The CAPEX for a DAF + biological system for a 50,000 m³/day fab typically ranges from $5M to $7M, including equipment, civil works, and installation.
How much energy does an MBR system consume compared to RO?
MBR systems generally consume 0.8–1.2 kWh/m³, while RO systems add an additional 0.5–0.8 kWh/m³. The combined energy demand for MBR + RO is higher than biological treatment alone.
Can advanced wastewater treatment significantly improve wafer fab water reuse goals?
Yes, advanced technologies like MBR + RO can enable water reuse rates of 70–90%, significantly higher than traditional DAF + biological systems which typically achieve 30–50% reuse.
What is the payback period for an MBR + RO system compared to a DAF + biological system?
For a 30,000 m³/day fab with 70% water reuse, an MBR + RO system can achieve a payback period of around 3.2 years, while a DAF + biological system might take 5.1 years.
What are the key benefits of hybrid wastewater treatment systems for semiconductor fabs?
Hybrid systems offer flexibility to handle diverse and complex wastewater streams (e.g., high salinity, metals), achieve very high removal efficiencies (up to 99.8% TSS), and maximize water reuse, leading to significant long-term OPEX savings and regulatory compliance.
Related Equipment
- MBR systems for semiconductor wastewater reuse — view specifications, capacity range, and technical data
Need a customized solution? Request a free quote with your specific flow rate and pollutant parameters.