What Makes Sodium-Ion Battery Wastewater Different
A sodium-ion battery wastewater treatment solution is a dedicated train — coagulation/DAF, biological MBR, two-pass RO, and selective Na⁺/NH₄⁺ polishing — engineered for the SIB-specific effluent: 1,500–6,000 mg/L Na⁺, 200–1,200 mg/L NH₃-N from hard-carbon carbonization, F⁻ from NaPF₆ hydrolysis, and trace V, Mn, Fe from Prussian-white and vanadium cathodes. Recovery rates reach 90–95% with 30–50% lower reagent cost than lithium-ion brine treatment. The high Na⁺ background alone disqualifies most LIB-recovery flowsheets: Na⁺ co-precipitates with Li₂CO₃ and LiOH selective-precipitation steps, forcing operators to abandon Li-recovery economics and refocus on water reuse and ZLD (per the 2024 LIB recycling paper on sodium-enriched brine treatment).
SIB wastewater is the combined stream from precursor co-precipitation (Prussian-white Na₂MnFe(CN)₆, layered Na₃V₂(PO₄)₃), hard-carbon carbonization, slurry coating, electrolyte mixing, formation, and aging. Each step carries a distinct signature. The aggregate carries 2–4× the Na⁺ loading of a typical LIB precursor stream (400–1,500 mg/L) and 3–5× the NH₃-N, while having only trace Li⁺ (typically < 5 mg/L). The seven marker contaminants an engineer must plan for: total Na⁺, NH₃-N, F⁻, sulfate, residual NMP/DMC solvent, trace V/Mn/Fe from cathode active materials, and high COD (800–3,500 mg/L) from hard-carbon binders and phenolic residues.
| Parameter | SIB Wastewater (typical) | LIB Wastewater (typical) | Design Implication |
|---|---|---|---|
| Na⁺ (mg/L) | 1,500–6,000 | 400–1,500 | Drives RO concentrate volume; blocks Li-selective precipitation |
| NH₃-N (mg/L) | 200–1,200 | 30–400 | Requires A/O-MBR with adequate alkalinity control |
| F⁻ (mg/L) | 50–500 | 50–300 | CaCl₂ precipitation before biological stage |
| COD (mg/L) | 800–3,500 | 500–2,000 | High COD/N ratio (> 8) requires carbon supplementation for nitrification |
| Trace V/Mn/Fe (mg/L) | 5–80 | < 5 (Co/Ni dominant) | Chemical precipitation stage specific to SIB cathode metals |
SIB Wastewater Influent Fingerprint by Process Step
Matching the treatment train to the right stream starts with knowing what each process step contributes. Precursor co-precipitation generates Na, sulfate, and ammonia wash water; cathode calcination scrubbing releases Na, K, and particulate; hard-carbon carbonization — the single highest-COD contributor — discharges NH₃-N at 200–1,200 mg/L with phenolic residues and COD of 2,000–4,000 mg/L. Electrode coating wastewater carries NMP at 500–2,000 mg/L alongside PVDF binder, while electrolyte prep releases F⁻ at 50–500 mg/L from NaPF₆ hydrolysis plus organic carbonates (DMC, EC). Formation and aging steps add LiPF₆-equivalent salts and trace HF, and the final assembly rinse contributes low-TDS water with suspended solids. The chemistry families driving these streams — Prussian-blue analogues, layered oxides, polyanionic phosphates, and hard carbon — are catalogued in WILEY Adv. Sustainable Syst. 1700153 (2018).
Combined flow from a ≥ 10 GWh/yr SIB plant typically averages pH 8.5–10.5, conductivity 8–25 mS/cm, and COD/N ratio above 8. That ratio is the operational red flag: it precludes single-stage biological nitrification without a softening front-end and forced alkalinity control, because nitrifiers need a balanced C:N:P and the high pH starves them of inorganic carbon.
| Process Step | Key Contaminants | Typical Range | Pre-Treatment Required |
|---|---|---|---|
| Precursor co-precipitation | Na⁺, SO₄²⁻, NH₃-N | Na⁺ 2,000–5,000 mg/L; SO₄²⁻ 500–2,000 mg/L | Equalization, pH trim |
| Cathode calcination scrubbing | Na, K, particulate, V/Mn/Fe traces | TSS 200–800 mg/L; metals 5–50 mg/L | Coagulation/DAF |
| Hard-carbon carbonization | NH₃-N, phenolics, COD | NH₃-N 200–1,200 mg/L; COD 2,000–4,000 mg/L | Biological A/O-MBR |
| Electrode coating | NMP, PVDF binder | NMP 500–2,000 mg/L | DAF + solvent recovery |
| Electrolyte prep | F⁻, organic carbonates | F⁻ 50–500 mg/L | CaCl₂ precipitation |
| Formation/aging | NaPF₆/NaFSI salts, trace HF | F⁻ 20–150 mg/L; conductivity 5–15 mS/cm | F⁻ polishing |
| Assembly rinse | Low TDS, suspended solids | TDS < 200 mg/L; TSS 50–200 mg/L | Filtration, RO |
Unit-Operation Process Flow for SIB Effluent
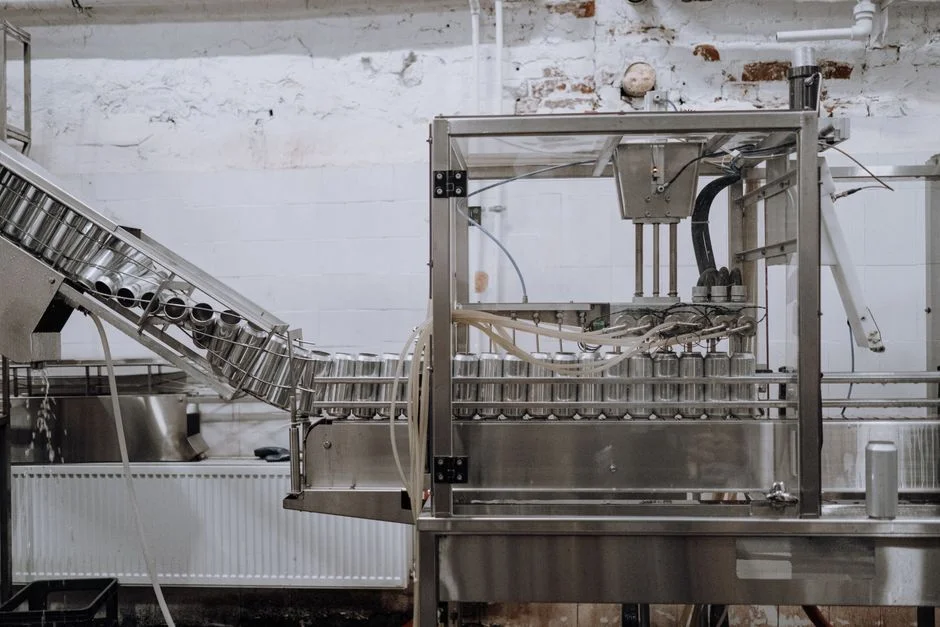
A defensible SIB treatment train runs in five stages with verified parameters. Stage 1 is equalization with pH trim to 7.0–8.5 — a 4–8 hour HRT buffer tank absorbs the shock loadings from batch carbonization and electrolyte-mix dumps. Stage 2 is coagulation followed by a dissolved air flotation system for SIB stream equalization, dosing alum (50–150 mg/L) and polyacrylamide (1–3 mg/L) at surface loading of 4–20 m/h, which strips suspended solids, residual NMP, and the bulk of V/Mn/Fe before the biological stage.
Stage 3 inserts a MBR membrane bioreactor for COD and ammonia polishing using PVDF flat sheet MBR modules at 0.1 μm pore size, configured as an anoxic/oxic (A/O) train. The submerged PVDF design runs at 10–20× lower specific energy than cross-flow ultrafiltration, with mixed liquor suspended solids (MLSS) held at 8,000–12,000 mg/L. Target effluent from the MBR is COD below 50 mg/L and NH₃-N below 5 mg/L — tight enough to feed two-pass RO without fouling.
Between DAF and MBR, a CaCl₂ precipitation stage drops F⁻ from 50–500 mg/L to under 10 mg/L using a stoichiometric Ca:F molar ratio of 1.5–2.0 at pH 7–8 with 30 minutes of contact time. Automatic chemical dosing for pH, F⁻, and antiscalant injection ties the CaCl₂, NaOH, and antiscalant pumps to inline pH and F⁻ probes. Stage 5 is a two-pass RO polishing train running at 90–95% overall recovery. First-pass RO handles 70–75% recovery; second-pass polishes the permeate to conductivity under 50 μS/cm and TOC under 2 mg/L for cathode-slurry rinse reuse. RO concentrate, carrying 8,000–20,000 mg/L Na⁺, is routed to a mechanical vapor recompression (MVR) crystallizer for ZLD — recovering Na₂SO₄ or NaCl as a saleable by-product. A plate and frame filter press for SIB sludge handles the DAF float and MBR waste, pressing cake moisture below 65% for off-site disposal. Engineers evaluating broader ZLD cost benchmarks should review the ZLD and crystallizer cost benchmarks for 2026 industrial effluent trains.
Do not attempt Li₂CO₃ or LiOH selective precipitation on the RO concentrate. Na⁺ co-precipitates and you lose both the Li and Na recovery options. Instead, accept Na⁺ in the concentrate and recover it via the crystallizer, or insert a monovalent-selective nanofiltration step to split Na⁺ from divalent reuse streams. Target overall water recovery is 90–95% with a reuse fraction above 80% for an SIB plant producing ≥ 10 GWh/yr.
| Stage | Unit Operation | Design Parameter | Target Effluent |
|---|---|---|---|
| 1 | Equalization + pH trim | HRT 4–8 h; pH 7.0–8.5 | Stable feed; no shock loading |
| 2 | Coagulation/DAF | Alum 50–150 mg/L; PAM 1–3 mg/L; surface loading 4–20 m/h | TSS < 30 mg/L; NMP < 50 mg/L |
| 2a | CaCl₂ precipitation (F⁻) | Ca:F molar 1.5–2.0; pH 7–8; 30 min contact | F⁻ < 10 mg/L |
| 3 | A/O-MBR (submerged PVDF) | MLSS 8,000–12,000 mg/L; pore 0.1 μm | COD < 50 mg/L; NH₃-N < 5 mg/L |
| 4 | Softener (Ca²⁺/Mg²⁺ removal) | Lime-soda or ion exchange; hardness < 20 mg/L as CaCO₃ | RO scaling prevention |
| 5 | Two-pass RO + MVR crystallizer | Pass 1: 70–75% recovery; Pass 2: 85–90% recovery; MVR ΔT 8–12 °C | Reuse: conductivity < 50 μS/cm; ZLD: Na₂SO₄ or NaCl crystals |
| 6 | Plate-and-frame filter press | 1–500 m²; chamber pressure 0.6–0.8 MPa | Cake moisture < 65% |
SIB vs LIB Wastewater: Side-by-Side Loading Comparison
The case for a dedicated SIB train rests on loadings, not theory. SIB streams carry 2–4× the Na⁺ and 3–5× the NH₃-N of a comparable LIB precursor plant, while LIB streams carry 5–20× the Li⁺ that an SIB operator does not have to recover. That asymmetry flips the economics: a LIB plant chases Li₂CO₃ or LiOH recovery to offset treatment cost; an SIB plant has no high-value Na⁺ recovery market, so it must optimize for water reuse and concentrate disposal cost. Even LIB recyclers now face SIB-like loadings when they co-process chemistries, as documented in the 2024 LIB recycling paper that introduced LiOH precipitation specifically for sodium-enriched streams — proof that the two effluent profiles are converging but still distinct.
| Parameter | SIB (mg/L) | LIB (mg/L) | Ratio (SIB:LIB) |
|---|---|---|---|
| Na⁺ | 1,500–6,000 | 400–1,500 | 2–4× |
| Li⁺ | < 5 | 50–500 | 0.01–0.1× |
| NH₃-N | 200–1,200 | 30–400 | 3–5× |
| F⁻ | 50–500 | 50–300 | 1–2× |
| Sulfate | 500–2,000 | 200–800 | 2–3× |
| COD | 800–3,500 | 500–2,000 | 1.5–2× |
| Trace V/Mn/Fe | 5–80 | < 5 (Co/Ni) | SIB-specific metals |
| Water-recovery ceiling | 90–95% (ZLD viable) | 70–85% (Li recovery caps reuse) | SIB higher |
2026 Discharge and Reuse Compliance Targets
Every P&ID must cite a specific standard. For SIB plants in Zhejiang, Anhui, and Jiangsu discharging to industrial parks, China GB/T 31962-2015 (wastewater into urban sewers) and GB 30485-2013 (battery industry COD ≤ 500 mg/L, NH₃-N ≤ 45 mg/L, Zn ≤ 5 mg/L) are the binding limits. For European gigafactories — including the CATL Erfurt expansion and Northvolt-adjacent SIB pilot lines in Hungary — EU Battery Regulation 2023/1542 Article 56(5) and Industrial Emissions Directive 2010/75/EU BAT-AEL set COD ≤ 250 mg/L, SS ≤ 30 mg/L, and total heavy metals ≤ 1 mg/L for plants at or above 2 GWh/yr. In the United States, EPA 40 CFR 433 (metal finishing) is the closest analogue for SIB precursor lines, with Cu/Ni/Zn limits that trigger the polishing stage.
Internal reuse targets are tighter than discharge limits. RO permeate should hit conductivity under 50 μS/cm, TOC under 2 mg/L, and silica under 5 mg/L to meet ultrapure rinse standards for cathode slurry. For broader treatment-train context, see industrial wastewater treatment design references, and for F⁻ and fluorinated-compound handling in battery effluent, the PFAS and fluorinated compound removal in battery effluent guide covers 2026 best available techniques.
CAPEX and OPEX Bands for a Turnkey SIB Treatment Skid
Procurement teams need defensible bands, not vendor quotes. CAPEX per m³/day of treatment capacity in 2025–2026 industrial battery-water bids runs $180–$420 for DAF plus MBR only, $420–$850 with two-pass RO, and $850–$1,600 with a full MVR crystallizer for ZLD. OPEX runs $0.08–$0.32 per m³ for DAF+MBR+RO, climbing to $0.45–$0.90 with MVR because of steam and antiscalant cost. Chemical spend — NaOH for pH trim, CaCl₂ for F⁻ precipitation, antiscalant for RO, and CIP chemicals — typically accounts for 18–28% of OPEX. At 80% reuse on a 5,000 m³/day SIB plant, freshwater cost avoidance of $1.20–$2.50 per m³ yields 3.5–6 year payback on the MVR-augmented train versus 2.5–4 years for DAF+MBR+RO only.
| Scope | CAPEX (USD per m³/day) | OPEX (USD per m³ treated) | Best-Fit Plant Size |
|---|---|---|---|
| DAF + MBR only | $180–$420 | $0.08–$0.18 | ≤ 2 GWh/yr, no ZLD requirement |
| DAF + MBR + two-pass RO | $420–$850 | $0.15–$0.32 | 2–10 GWh/yr, reuse-focused |
| Full ZLD with MVR crystallizer | $850–$1,600 | $0.45–$0.90 | ≥ 10 GWh/yr or zero-discharge permit |
Six-Step Vendor Selection Checklist for 2026 RFQs
Walking into a 2026 RFQ, run every bidder through six filters. (1) SIB-specific reference plants commissioned in the last 24 months — not LIB projects rebranded. (2) Guaranteed effluent values on the bid, not typical values; the guarantee must be bonded. (3) MBR and RO sized for 1.3× design flow with CIP provisions and redundancy on critical pumps. (4) F⁻ and Na⁺ polishing included in the base scope, not priced as a change order. (5) Factory acceptance test using simulated SIB influent — not tap water. (6) Lifecycle OPEX guarantee bonded for at least 12 months post-commissioning. Red flag: vendors quoting LIB-only references or refusing to name the softening and antiscalant regime in writing typically fail on filter 4 and should be eliminated before technical scoring.
Frequently Asked Questions
What is the typical Na⁺ concentration in sodium-ion battery wastewater? Combined SIB plant effluent typically carries 1,500–6,000 mg/L Na⁺, with hard-carbon carbonization and precursor co-precipitation as the dominant sources — 2–4× higher than comparable LIB precursor streams.
How is fluoride removed from NaPF₆-contaminated SIB electrolyte wastewater? Calcium chloride precipitation at a Ca:F molar ratio of 1.5–2.0, pH 7–8, and 30 minutes of contact time drops F⁻ from 50–500 mg/L to under 10 mg/L before biological polishing.
Why can't SIB wastewater use the same Li₂CO₃ or LiOH precipitation step as LIB recycling? Sodium co-precipitates with lithium-selective reagents, contaminating the Li₂CO₃ or LiOH product and forfeiting both Li and Na recovery. SIB plants instead route concentrate to an MVR crystallizer for Na₂SO₄ or NaCl recovery.
What overall water recovery rate can a 2026 SIB treatment train achieve? A properly sized DAF+MBR+RO+MVR train reaches 90–95% overall water recovery with a reuse fraction above 80% for an SIB plant producing ≥ 10 GWh/yr.
Which 2026 EU regulation sets the strictest effluent limit for SIB gigafactories in Europe? EU Battery Regulation 2023/1542 Article 56(5) combined with IED 2010/75/EU BAT-AEL sets COD ≤ 250 mg/L, SS ≤ 30 mg/L, and total heavy metals ≤ 1 mg/L for plants at or above 2 GWh/yr.