PFAS Removal Technology Key Players for Industrial Buyers
PFAS removal technology key players in 2026 cluster into three tiers: adsorption (GAC and ion exchange), separation (RO and nanofiltration), and destruction (SCWO, electrochemical oxidation, plasma, and thermal reactivation). Below 1,000 ng/L, single-pass GAC or ion exchange usually minimizes cost. From 1,000–10,000 ng/L, RO pre-concentration plus polishing is typical. Above 10,000 ng/L, concentrate destruction is non-optional for industrial buyers.
Three regulatory clocks converged on industrial buyers in 2026, and none of them allow deferral. The US EPA's 2024 final National Primary Drinking Water Regulation (NPDWR) is now in force. Maximum contaminant levels are 4 ppt for PFOA and PFOS individually. PFNA and HFPO-DA (GenX) sit at 10 ppt, PFHxS at 5 ppt, plus a Hazard Index of 1 for any mixture of four regulated PFAS (per EPA 40 CFR 141.900). The April 2024 EPA NPDES memorandum authorizes states to translate those health advisories into numeric effluent limits in industrial discharge permits. Site-specific NPDES PFAS limits in Michigan, New Jersey, and North Carolina now run 10–100× stricter than the drinking water MCLs. Across the Atlantic, the EU REACH universal PFAS restriction (Annex XVII entry proposed by ECHA, 2023) carries staged transition windows through 2025 and into mid-2026 for several industrial use categories. The May 2026 grace period effectively ends new PFAS-containing process aids in most manufacturing sites. An industrial procurement engineer cannot treat vendor selection as a 2027 problem. Civil, criminal, and reputational penalty exposure now attaches to every operating quarter.
The PFAS Treatment Technology Stack: Adsorption, Separation, and Destruction
Every vendor on the 2026 shortlist sells into one of three technology tiers. Influent concentration at the plant boundary dictates which tier carries the load. The adsorption tier is dominated by granular activated carbon (GAC). Calgon Carbon's FILTRASORB and Cabot/Chemviron's reactivation-service carbon hold the longest field record. Purolite and DuPont AmberLite ion-exchange resins extend performance to short-chain PFAS that slip past GAC. A 2024 ScienceDirect study on ionic-liquid-grafted activated carbon demonstrated selective PFAS removal with regenerable capacity. That development may move into commercial scale by late 2026.
The separation tier — high-pressure reverse osmosis and tight nanofiltration from Veolia, Toray, and LG Chem — does not destroy PFAS. It concentrates them into a 5–15% reject stream that must be handed to the next tier. The destruction tier covers supercritical water oxidation (SCWO, commercialized by 374Water at temperatures above 374 °C and 221 bar), electrochemical oxidation (Aclaris Labs, Claros Environmental), plasma arc (Plasco), and thermal reactivation of spent GAC. Calgon Carbon validated that reactivation pathway in a 2025 peer-reviewed Remediation Journal study showing PFAS destruction during the custom municipal reactivation cycle.
The routing rule is straightforward. Below 1,000 ng/L, single-pass GAC or ion exchange is the cost-minimizing answer. The 1,000–10,000 ng/L band requires RO pre-concentration feeding a polishing bed. Above 10,000 ng/L — AFFF source zones and landfill leachate concentrates — destruction of the concentrate is non-optional. Adsorption-only vendors must disclose who burns their spent media. Most plants we size for industrial polishing run at the lower end of the adsorption range until leachate or AFFF spikes push the train into RO. Industrial buyers operating at these high concentrations typically pair the PFAS train with industrial RO systems for PFAS pre-concentration to keep the downstream destruction reactor within its design throughput.
What is the best technology to remove PFAS?
The best technology to remove PFAS from industrial wastewater depends on influent concentration, co-contaminants, and whether the permit requires destruction or only removal. For streams below 1,000 ng/L with modest COD, GAC or ion exchange usually wins on OPEX. Between 1,000 and 10,000 ng/L, RO plus polishing beds handle the load while shrinking the destruction volume. Above 10,000 ng/L, SCWO, electrochemical oxidation, or verified thermal reactivation of spent media become the decision drivers, not media brand alone.
Which Providers Supply Industrial PFAS Removal Technologies?
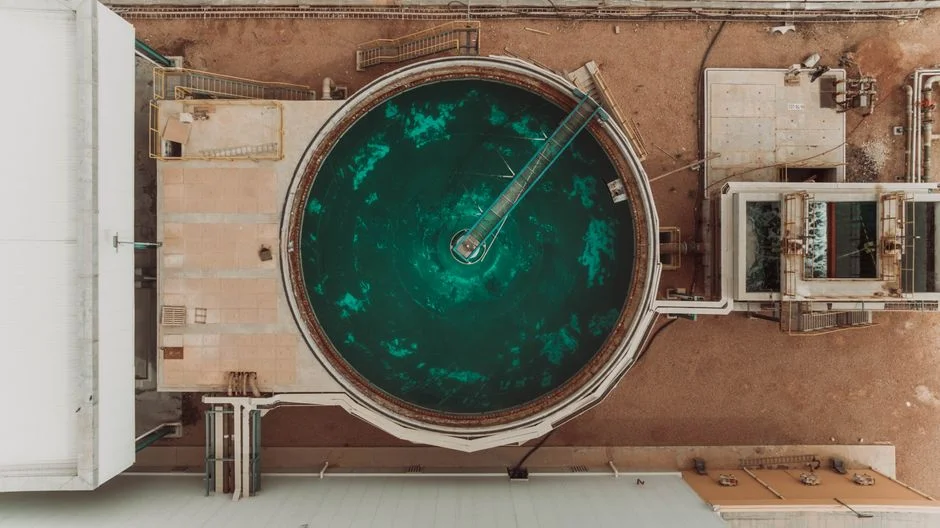
Industrial PFAS removal technology providers that appear most often in 2026 RFP responses span adsorption specialists, full-train EPC integrators, and destruction specialists. The matrix below consolidates seven suppliers that consistently appear in those responses. Cost figures are indicative ranges drawn from publicly disclosed project data and vendor proposal summaries, not binding quotes. Treat them as ±25% envelopes for budgetary purposes.
| Company | HQ | Core Tech | Target Application | Indicative CAPEX (USD/m³/day) | Indicative OPEX (USD/m³ treated) | Key Certifications | Procurement Note |
|---|---|---|---|---|---|---|---|
| Calgon Carbon (Kuraray) | US | FILTRASORB GAC + thermal reactivation | Drinking water, industrial polishing | 300–600 | 0.15–0.45 | ISO 9001, ISO 14001, NSF/ANSI 61 | Validate the destruction verification chain for reactivation services before contracting |
| Cabot / Chemviron | BE / US | GAC + EU reactivation network | European drinking water utilities, industrial | 350–650 | 0.20–0.50 | ISO 9001, ISO 14001, EN 12907 | Strongest EU regulatory documentation; confirm reactivation kiln permits for 2026 |
| Veolia Water Technologies | FR | Full RO + GAC trains, EPC delivery | Large industrial sites, landfill leachate | 2,000–4,000 | 0.80–1.80 | ISO 9001, ISO 14001, ISO 45001 | EPC integrator; confirm which GAC/IX brand is packaged inside the train |
| CycloPure | US | DEXSORB polymer adsorbent | Short-chain PFAS, drinking water | 400–800 | 0.25–0.55 | NSF/ANSI 61 | Strong on PFBA/PFPeA; limited full-scale track record above 1,000 ng/L |
| 374Water | US | Supercritical water oxidation (SCWO) | AFFF concentrate, landfill leachate | 16,000–36,000 | 2.50–6.00 | EPA ETV (under review, 2025) | Destruction >99.99% claimed; demand third-party mass-balance proof |
| Aclaris Labs | US | Electrochemical oxidation, mobile trailers | Treat-and-discharge, AFFF remediation | 20,000–40,000 | 3.00–7.00 | ISO 9001 | Mobile units suit short-duration remediation; verify electrode life at your chloride loading |
| Chinese regional OEMs (incl. HydropureWater) | CN | Pretreatment + RO polishing trains | Industrial wastewater, landfill leachate, Southeast Asia & Africa projects | 800–1,800 | 0.30–0.90 | ISO 9001, ISO 14001 (varies) | Cost-competitive on CAPEX; confirm local service footprint and consumables supply |
For buyers building an industrial shortlist, the matrix is a starting point, not a conclusion. No single vendor covers the full concentration range in the 2026 market. The typical project team pairs an adsorption or separation vendor for the bulk train with a destruction vendor for the concentrate, and routes pretreatment through a regional OEM with industrial wastewater depth. When you compare PFAS removal technology key players on CAPEX alone, you miss the spent-media liability that often dominates total cost of ownership. Readers building the business case around this matrix should also review the broader 2026 PFAS market drivers analysis for context on pricing pressure and supply chain risk.
Industrial vs Drinking Water: Why the Technology Choice Diverges
The most common procurement error in 2026 is porting a drinking-water PFAS solution into an industrial matrix. Drinking water influent typically sits at 1–100 ng/L (ppt). Industrial landfill leachate runs 100–10,000 ng/L. AFFF source zones reach 1,000,000 ng/L — three orders of magnitude between the cleanest and dirtiest streams a buyer will encounter. Volume and matrix work in the opposite direction. Drinking water utilities move millions of m³/day at low concentration, which favors adsorption and low-cost media changeout. Industrial sites move thousands of m³/day at high concentration with co-contaminants (COD 5,000–50,000 mg/L, ammonia 100–2,000 mg/L, heavy metals), which fouls GAC and IX resins on contact.
A biological stage and Dissolved Air Flotation (DAF) System pretreatment for industrial PFAS streams is non-negotiable before the adsorption bed. Skipping that pretreatment shows up as media changeout every 30–60 days instead of every 6–18 months. Regulatory exposure also diverges. Drinking water follows EPA NPDWR MCLs. Industrial discharge follows site-specific NPDES limits that — in Michigan, New Jersey, and several other states — can be 10–100× tighter than the MCLs that anchor most vendor marketing claims. Semiconductor and medical/hospital parallels differ again, but the pretreatment logic matches what a general industrial wastewater OEM applies to any high-strength stream. Desalination-oriented membrane vendors appear in the separation tier, yet they are not interchangeable with destruction specialists when the RFP asks for a permanent PFAS endpoint.
How to Qualify a PFAS Vendor in 2026: A 4-Step Buyer's Checklist
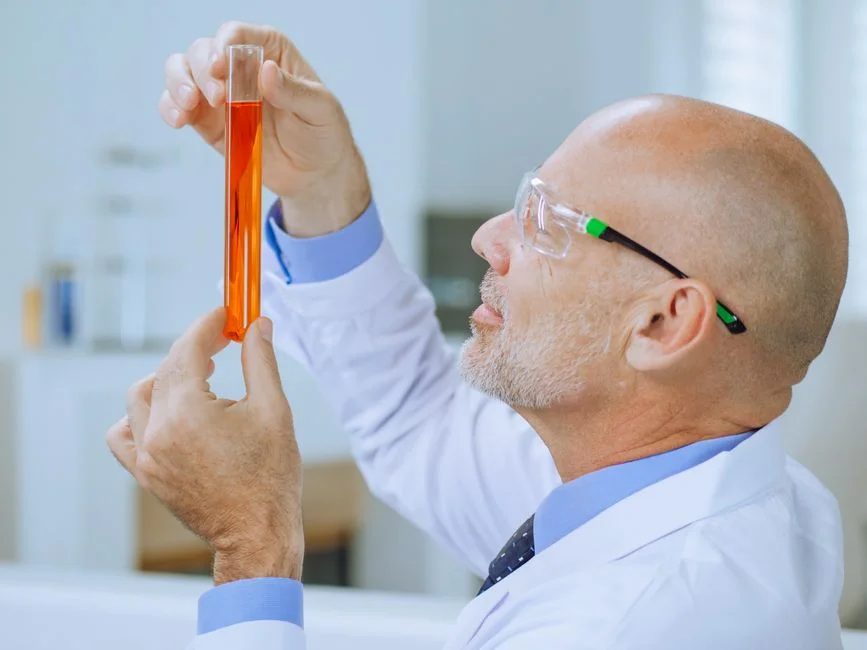
Procurement engineers with a 6–10 week RFP window cannot afford a six-month vendor bake-off. The four-step sequence below compresses qualification into a defensible decision trail.
- Demand third-party validated performance at your influent concentration. Reject lab data generated in deionized water. Require pilot or full-scale data at your actual ng/L range, with the analytical method (LC-MS/MS) and detection limit disclosed in writing.
- Audit the destruction pathway. If the vendor sells adsorption only, ask who incinerates the spent media. EU and California incineration permits are tightening through 2025–2026. A vendor that cannot document downstream destruction is selling you a liability, not a solution.
- Confirm regulatory documentation. NSF/ANSI 61 for any drinking-water contact, ISO 14001 for environmental management, EPA Environmental Technology Verification (ETV) where available, and project-specific discharge permits in hand before contract signature.
- Run a 90-day containerized pilot. Most reputable vendors offer 10–50 m³/day pilot units for USD 25,000–80,000. The cost is recoverable against CAPEX. The data is the single strongest defense in any regulator-facing design basis memo.
Selection checklist for the RFP packet covers seven items. Capture influent PFAS profile by chain length, COD/ammonia/metals matrix, and design flow in m³/day. Add discharge limit source (NPDWR vs NPDES), spent-media destruction path in writing, pilot scope with analytical method, and local service plus consumables lead time. Skip any item and the bid comparison becomes theater.
2026 Cost Benchmarks: CAPEX and OPEX by Technology Tier
The figures below are 2026 USD ranges assembled from publicly disclosed municipal and industrial project awards plus vendor proposal summaries. Use them as the first draft of a Class 4 budget estimate (±30–50%). Refine with vendor quotes after the pilot.
| Technology Tier | Design Flow | Influent PFAS | CAPEX (USD total) | OPEX (USD/m³ treated) | Dominant OPEX Driver |
|---|---|---|---|---|---|
| GAC-only train | 5,000 m³/day | 1–100 ng/L | 1.5–3.0 M | 0.20–0.45 | Carbon replacement every 6–18 months |
| RO + GAC polishing | 2,000 m³/day | 100–10,000 ng/L | 4.0–8.0 M | 0.80–1.80 | Membrane replacement 3–5 years, energy |
| Full train with destruction | 500 m³/day | >10,000 ng/L | 8.0–18.0 M | 2.50–6.00 | Energy, concentrate disposal, electrode/kiln maintenance |
Each of these CAPEX envelopes assumes a complete pretreatment building block upstream of the PFAS unit operations. Multi-media filtration for PFAS system protection and an automatic chemical dosing system typically sit ahead of the RO or GAC contactor. Those units remove suspended solids and stabilize pH to protect downstream membranes and carbon from fouling. Skipping that pretreatment stage is the most expensive line-item omission a buyer can make. The failure shows up as OPEX overruns in the first 12 months of operation, not as a CAPEX line item at award.
Where oil, grease, or solids load the feed, a second DAF pretreatment for industrial PFAS streams stage ahead of media contactors is cheaper than replacing carbon every month.
Who This Is For and Next Step
This guide is for plant engineers, EPC contractors, and procurement managers sizing industrial PFAS trains against NPDES or equivalent discharge limits. Buyers chasing only municipal drinking-water polishing at 1–100 ng/L should shortlist GAC/IX specialists first and skip destruction CAPEX. If your influent, permit, and flow band are already defined, request a PFAS treatment train quote with those three numbers so the process design stays inside the right tier from the first proposal.
Frequently Asked Questions
Which PFAS removal technology is most cost-effective below 1,000 ng/L?
Granular activated carbon remains the lowest OPEX option for industrial streams below 1,000 ng/L. OPEX typically runs USD 0.15–0.45/m³ for Calgon FILTRASORB or Chemviron carbon at that concentration band. Indicative CAPEX sits at USD 300–600 per m³/day of design flow when reactivation logistics are available. Ion exchange can beat GAC on short-chain species, but carbon still wins most low-strength industrial polishing bids on total cost.
What influent concentration requires a destruction endpoint rather than adsorption?
Streams above 10,000 ng/L — AFFF source-zone groundwater and concentrated landfill leachate — should be routed to SCWO (374Water), electrochemical oxidation (Aclaris Labs), or thermal reactivation of spent GAC. Adsorption-only trains at that strength generate a spent-media volume that exceeds practical incineration capacity. Demand third-party mass-balance proof before accepting any destruction claim above 99.99%.
How long does a 90-day PFAS pilot typically cost?
A containerized 10–50 m³/day pilot from a reputable vendor runs USD 25,000–80,000 fully loaded. That envelope usually includes mob/demob, consumables, and third-party LC-MS/MS analysis for the campaign. Most plants we size for recover the pilot fee against CAPEX at contract award, and the dataset becomes the strongest defense in a regulator-facing design basis memo.
Are the EPA MCLs of 4 ppt for PFOA and PFOS enforceable in 2026?
Yes. The EPA NPDWR was published April 10, 2024, with compliance deadlines phased through 2029. Public water systems must complete initial monitoring by 2027 and meet MCLs by 2029 under that schedule. NPDES industrial permits in several states already enforce equivalent or stricter limits under the 2024 EPA NPDES memo, so industrial buyers cannot wait for the 2029 drinking-water deadline.
Do Chinese OEMs meet the same certifications as US/EU PFAS vendors?
Leading Chinese OEMs hold ISO 9001 and ISO 14001 and increasingly NSF/ANSI 61 on specific product lines, but certification coverage varies by supplier. The procurement note in the matrix above flags this as a check item before award. Project-specific discharge permits in the destination country ultimately govern acceptance, not the brochure logo set.