Why Sarawak's 2026 Industrial Effluent Compliance Is Different
Sarawak draws roughly 96% of its potable water from rivers, so any industrial discharge to inland waterways directly threatens downstream abstraction points including Kuching's Batu Kitang intakes and Sibu's Sungai Selalang (per Mahmud et al. and the DID Sarawak resource page). Industrial wastewater treatment in Sarawak Malaysia in 2026 must therefore satisfy the Department of Environment Industrial Effluent Regulations 2009 (P.U.(A)434) and its amendments, with typical Standard B limits of BOD₃ ≤ 20 mg/L, COD ≤ 50 mg/L, TSS ≤ 50 mg/L, oil & grease ≤ 5 mg/L, ammoniacal nitrogen ≤ 5 mg/L, and pH 5.5–9.0; Standard A (catchment protection) tightens BOD₃ and COD to ≤ 10 mg/L and ≤ 25 mg/L respectively. Most Sarawak mills and refineries fall under Standard B unless their outfall sits inside a water-supply catchment, in which case the EPC must design for Standard A from day one.
Sarawak's industrial geography is unusually concentrated. The Sarawak Corridor of Renewable Energy (SCORE) runs from Tanjung Manis through Sibu, Bintulu, and Samalaju to Miri, anchoring palm-oil processing in the Rajang valley, timber/plywood in Sibu and Bintulu, petrochemicals and LNG in Bintulu and Miri, and food/beverage clusters around Kuching-Serian. Mahmud et al. observed "explosive development" in Kuching, Miri, Sibu, and Bintulu, and that pressure has not eased; it raises the enforcement intensity a 2026 tender must anticipate.
Influent Characteristics by Major Sarawak Industry
Process selection starts from the influent fingerprint, not the discharge limit. The table below summarises typical 2026 feed characteristics across the four industrial profiles that dominate SCORE corridor and urban Sarawak tender enquiries. All ranges reflect well-established engineering data and on-site POME characterisation studies; Envilab under ITS Water Malaysia offers accredited influent characterisation for Sarawak sites, which we recommend every tender includes as a paid line item before final design freeze.
| Industry / Source | Typical flow | pH | COD (mg/L) | BOD (mg/L) | TSS (mg/L) | Oil & grease (mg/L) | Temperature |
|---|---|---|---|---|---|---|---|
| Palm-oil mill effluent (POME) | 0.6–1.0 m³/tonne FFB | 3.5–4.5 | 25,000–80,000 | 15,000–50,000 (BOD₃₀) | 10,000–25,000 | 2,000–8,000 | 80–90 °C at source |
| Timber / plywood processing | 5–20 m³/m³ timber | 4–7 | 1,500–6,000 | 600–2,500 | 500–3,000 | 200–1,500 (resin/wax) | 25–35 °C ambient |
| O&G / refinery (Bintulu, Miri) | 0.4–1.6 m³/m³ crude | 6–9 | 300–1,500 | 150–600 | 50–500 | 100–1,000 (free oil layer) | 30–45 °C |
| Food / beverage (Kuching, Sibu) | 2–8 m³/tonne product | 4–8 | 1,000–8,000 | 500–4,800 (BOD/COD ≈ 0.5–0.6) | 300–2,000 | 50–400 | 25–40 °C |
The POME row is the headline: a high-strength, acidic, near-boiling stream that demands anaerobic pre-treatment and significant cooling/heat-recovery before any aerobic polishing can hold MLSS. Timber/plywood streams swing on suspended solids and resin/wax fractions, which is why dissolved air flotation remains the workhorse for that sector. O&G influents carry a separable free-oil layer that an API/CPI separator must skim before biological treatment can perform. Food/beverage streams are biodegradable but arrive in batch surges, so equalisation and SBR scheduling are usually decisive.
Process Train Selection: From Screening to Polishing
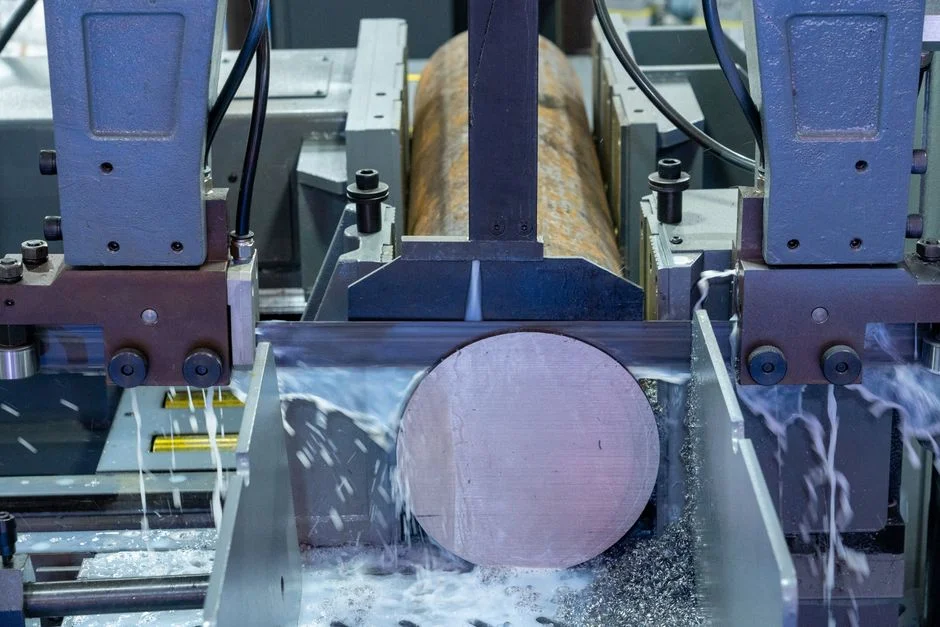
A defensible Sarawak process train is rarely fewer than six unit operations. The sequence below matches the load profile of a typical Bintulu palm-oil or Miri refinery outfall and doubles as a defensible response to a third-party EPC or DOE technical review.
Step 1 — Screening. A GX Series rotary mechanical bar screen at 6–10 mm aperture is the standard first defence against fruit bunches, rags, and fibrous debris in POME; its stainless rake teeth and dual overload protection suit continuous-duty mill operation.
Step 2 — Flow and load equalisation. A 6–24 hour HRT buffer damps POME's diurnal steriliser-cycle spikes, protecting downstream biology from shock loads and reducing aeration energy waste by 10–20%.
Step 3 — Primary clarification or DAF. For high-FOG and high-TSS streams, a micro-bubble dissolved air flotation (DAF) system removes 60–90% of TSS and 70–95% of FOG at surface loadings of 5–20 m³/m²/h. The 13 standard models span 4–300 m³/h and accept automatic skimming.
Step 4 — Anaerobic pre-treatment. A covered anaerobic lagoon, UASB, or CSTR cuts POME COD of 25,000–80,000 mg/L by 80–90% while generating 20–28 m³ of biogas per m³ of POME — the single largest OPEX offset on a mill balance sheet (HydropureWater field data, 2026).
Step 5 — Aerobic biological polishing. MBR, MBBR, or SBR (compared in the next section). For reuse-grade polishing, an integrated MBR membrane bioreactor system with PVDF submerged membranes at 0.1 μm pore holds MLSS at 8,000–12,000 mg/L and delivers TSS < 1 mg/L.
Step 6 — Tertiary polishing. A multi-media filter, with optional RO, takes the MBR permeate to reuse quality; a JY integrated water purification unit polishes surface water to ≤ 3 NTU turbidity.
Step 7 — Disinfection. A chlorine dioxide generator sized 50 g/h to 20,000 g/h provides on-site ClO₂ generation, avoiding the transport of chlorine cylinders and supporting EPA/EU potable-reuse compliance. UV or ozone are valid alternatives where chlorinated by-products are a concern.
Step 8 — Sludge handling. A plate and frame filter press with 1–500 m² filtration area dewaters POME biosolids to ≥ 25% DS cake, cutting hauling volume and landfill cost. The same supplier's automatic chemical dosing system controls flocculant feed at 1–5 mg/L anionic PAM.
Process Train Comparison: MBR vs SBR vs MBBR for Sarawak Sites
The biological step is where EPC bids diverge most. The table below summarises typical 2026 performance for the four configurations a Sarawak tender will encounter, calibrated against the MBR market growth 2026 outlook and the historical EAAS deployments documented in Mahmud et al. for small Sarawak sites.
| Parameter | MBR | SBR | MBBR | Conventional ASP |
|---|---|---|---|---|
| Effluent COD (mg/L) | 30–50 | 40–80 | 50–100 | 60–120 |
| Effluent TSS (mg/L) | < 1 | 10–20 | 20–40 | 20–50 |
| Footprint (m² per 100 m³/day) | ~18–25 | ~25–35 | ~20–30 | ~45–60 |
| Operator skill required | High (membrane care) | Moderate (batch logic) | Low–Moderate | Moderate (bulking risk) |
| Energy use (kWh/m³) | 0.5–0.8 | 0.3–0.5 | 0.25–0.45 | 0.3–0.5 |
| CAPEX index (vs ASP = 1.0) | 1.5–1.9 | 1.1–1.3 | 0.9–1.1 | 1.0 (baseline) |
| Best-fit Sarawak industry | Reuse-grade effluent, constrained plot (Kuching urban, SCORE water reuse) | Small palm-oil mills, food processors with batch flow (Sibu, Serian) | Timber/POME polishing, retrofits of existing aeration tanks | Budget-driven upgrades, large rural sites |
For a 2026 Bintulu palm-oil mill with a constrained plot and a 30–40% biogas offset, the MBR + UASB combination usually wins on whole-of-life. For a Sibu timber laminate plant, an MBBR polish on top of an existing aeration tank is the most defensible retrofit. For a greenfield Serian dairy plant, SBR offers the cleanest match between batch influent and batch discharge.
Equipment Sizing Parameters for Sarawak Conditions
The numbers below are the level of detail a vendor cannot bluff past in a tender. Each is a typical engineering range; if a bidder deviates, the deviation must be justified in writing.
DAF. Surface loading 5–20 m³/m²/h for FOG-rich Sarawak streams; hydraulic retention 20–40 minutes; recycle ratio 20–30% (HydropureWater field data, 2026).
UASB. Upflow velocity 0.7–1.0 m/h for POME; organic loading 10–15 kg COD/m³/day; mesophilic operation at 30–38°C aligns with Sarawak ambient and removes the heating cost that colder-climate plants carry.
MBR. MLSS 8,000–12,000 mg/L; membrane flux 15–25 L/m²/h; Sarawak's stable 25–32°C ambient supports reliable operation without enclosure heating. For energy minimisation, see the aeration energy cost optimization 2026 guide.
Chemical dosing. Polyaluminium chloride (PAC) 50–200 mg/L plus anionic polyacrylamide 1–5 mg/L; a HydropureWater automatic chemical dosing system delivers PLC-controlled precision and reduces over-feed by 10–20% versus manual dosing.
Lamella clarifier. Surface loading 20–40 m³/m²/h, a high-efficiency sedimentation tank reducing chemical consumption by up to 30% versus conventional clarifiers.
Suspended-solids removal is the single most common bottleneck on a Sarawak tender; the dedicated suspended solids removal engineering guide walks through the failure modes.
2026 CAPEX and OPEX Benchmarks for Sarawak Industrial Plants
The table below reflects typical 2026 turnkey installed costs in USD, including civils, equipment, instrumentation, and commissioning, but excluding land and power-supply upgrades. The OPEX rows are presented separately so suppliers cannot hide labour or membrane costs inside the headline.
| Plant size (m³/day) | Primary treatment (USD) | Biological (USD) | Tertiary (USD) | Sludge handling (USD) | Instrumentation / SCADA (USD) | Total installed (USD) |
|---|---|---|---|---|---|---|
| 50 | 35,000–60,000 | 60,000–110,000 | 20,000–40,000 | 20,000–40,000 | 15,000–30,000 | 150,000–280,000 |
| 200 | 80,000–140,000 | 160,000–240,000 | 50,000–90,000 | 50,000–90,000 | 40,000–60,000 | 380,000–620,000 |
| 500 | 170,000–260,000 | 320,000–500,000 | 110,000–180,000 | 100,000–170,000 | 80,000–110,000 | 780,000–1,200,000 |
| 1,000 | 300,000–500,000 | 650,000–1,200,000 | 200,000–400,000 | 200,000–400,000 | 150,000–300,000 | 1,500,000–2,800,000 |
Typical 2026 OPEX breakdown: electricity 45–55%, chemical dosing 15–20%, sludge hauling 15–20%, labour 10–15%, and membrane replacement 5–10% on MBR plants (HydropureWater field data, 2026). Whole-plant OPEX lands at USD 0.18–0.55 per m³ treated for well-designed 2026 systems; POME-anaerobic plants typically offset 30–40% of electrical OPEX through biogas utilisation. The DID Sarawak "process → quality → receiving water" framework remains the basis for design margin, and water-reuse projects in the SCORE corridor should also reference the industrial water reuse market 2026 drivers.
Supplier Evaluation Checklist for a 2026 Sarawak Tender
Use the following seven weighted criteria to separate engineering bidders from equipment brokers. The 2026 SCORE corridor has no shortage of the second type.
- Reference plant list with effluent data. Demand a Malaysian or regional reference list with measured BOD, COD, TSS, and O&G at the outfall — not marketing photographs.
- In-house PID and P&ID capability. The bidder must own or directly control process design; sub-contracted PID is a red flag for change-order risk.
- Local Sarawak or SE Asia service partner. A stocking warehouse in Kuching, Bintulu, or Miri, or a documented JV (the model SIIC Ranhill has used for industrial-park BOT/PPP), cuts membrane and spare-parts response time from weeks to days.
- ISA-95 / SCADA integration. The control system must export to the customer's plant historian, not lock the operator into a proprietary HMI.
- Process and membrane warranty ≥ 5 years. A 12-month warranty on a 25-year asset is a commercial red flag.
- Operator training and O&M handover. Commissioning must include structured classroom and on-job training plus an O&M manual in Bahasa Malaysia or English.
- Component-level compliance certification. Pumps, panels, membranes, and instruments must carry CE/EPA/MOH or equivalent marks; partial certification is a tender-disqualification item.
Flag any bidder offering only "imported equipment" without local commissioning — a recurring failure mode in Sarawak projects where the EPC scope quietly disappears at site handover.
Frequently Asked Questions
What are the 2026 DOE Sarawak discharge limits for industrial effluent? Standard B typically caps BOD₃ at ≤ 20 mg/L, COD ≤ 50 mg/L, TSS ≤ 50 mg/L, oil & grease ≤ 5 mg/L, ammoniacal nitrogen ≤ 5 mg/L, and pH 5.5–9.0 per P.U.(A)434; Standard A (catchment protection) tightens BOD₃ and COD to ≤ 10 mg/L and ≤ 25 mg/L.
MBR vs SBR for a Sarawak palm-oil mill — which is more defensible? MBR delivers TSS < 1 mg/L at 0.5–0.8 kWh/m³ on a 60% smaller footprint; SBR at 0.3–0.5 kWh/m³ is cheaper and simpler for batch-flow food plants.
How much methane can a POME anaerobic system recover? 20–28 m³ CH₄ per m³ of POME, typically offsetting 30–40% of the mill's electrical OPEX (HydropureWater field data, 2026).
What is a defensible 2026 CAPEX envelope for a 200 m³/day Sarawak plant? USD 380,000–620,000 turnkey installed, with OPEX of USD 0.18–0.55 per m³ treated depending on influent strength and discharge standard.
What documents must a Sarawak industrial tender submit to DOE? EIA, process mass balance, effluent parameter projections against Standard A or B, sludge management plan, and a monitoring schedule aligned to P.U.(A)434; engage a registered EIA consultant before tender issue.