What Pet Food Effluent Actually Looks Like
Pet food effluent typically carries 3,000–12,000 mg/L COD, 1,500–6,000 mg/L BOD₅, 800–3,500 mg/L TSS, and 200–2,000 mg/L FOG from cooker cleanup, pre-cook flour, and rendering. Three production streams drive that envelope: dry kibble lines (extruder cleanup and pre-cook slurry, 5,000–12,000 mg/L COD), wet/semi-moist/sachet lines (retort condensate, 3,000–8,000 mg/L COD), and treat or jerky lines (rendering washwater, 6,000–12,000 mg/L COD with 1,000–2,000 mg/L FOG). The BOD/COD ratio sits at 0.4–0.55, which is high enough that biological treatment is the right workhorse, and low enough that FOG and suspended solids have to come out first.
Flow is not steady. CIP, batch cooking, and the end-of-shift washdown push a peak-to-average ratio of 1.8–2.5 across a 24-hour cycle, and that ratio alone sets the equalization tank size. Treatability of high-strength pet food wastewater has been formally evaluated in continuous-flow aerobic systems (ResearchGate, 2008), which confirmed biological conversion is feasible at industrial loadings — the design problem is not whether biology works, but how to protect it from FOG and temperature swings. A 2026 reference design for a 50 m³/d plant sized to the Monogram treat-plant precedent uses rotary screening, dissolved air flotation for FOG, equalization, and an SBR or MBR biological stage (HRT 8–24 h, MLSS 3,500–6,000 mg/L), followed by ClO₂ disinfection, with installed CAPEX typically USD 280–520k.
| Parameter | Dry kibble | Wet / semi-moist / sachet | Treat / jerky | Combined plant (typical 2026) |
|---|---|---|---|---|
| COD (mg/L) | 5,000–12,000 | 3,000–8,000 | 6,000–12,000 | 3,000–12,000 |
| BOD₅ (mg/L) | 2,500–6,000 | 1,500–4,500 | 3,000–6,000 | 1,500–6,000 |
| BOD/COD | 0.45–0.55 | 0.40–0.55 | 0.45–0.55 | 0.40–0.55 |
| TSS (mg/L) | 1,000–3,500 | 800–2,000 | 1,500–3,000 | 800–3,500 |
| FOG (mg/L) | 200–800 | 200–1,200 | 1,000–2,000 | 200–2,000 |
| TKN (mg/L) | 100–300 | 100–250 | 150–400 | 100–400 |
| pH | 5.5–8.0 | 6.0–8.5 | 5.5–7.5 | 5.5–8.5 |
| Temperature (°C) | 30–50 | 35–55 | 35–55 | 30–55 |
| Peak/average flow | 1.8–2.5 | 1.8–2.5 | 2.0–2.5 | 1.8–2.5 |
Pretreatment: Screening, Grit Removal, and Equalization
Headworks for pet food wastewater exist to protect the pumps, the DAF cell, and the biological stage from solids that do not belong there. Specify a rotary mechanical bar screen with 3–5 mm aperture ahead of any lift station; this drops TSS by 15–25% and removes the packaging fiber, meat trimmings, and bone fragments that come off the cooker line and the floor wash. Coarse grit removal is usually not a separate unit on a packaged pet food plant — the rotary screen handles it — but a small grit chamber is worth specifying if the site receives any rendering stream from off-site trucks.
Equalization is the second non-negotiable step. The 1.8–2.5 peak-to-average ratio from CIP and batch cooking cannot be averaged out by the biological stage; the EQ tank has to. Size it for HRT 8–12 h at average daily flow, with mechanical mixing and low-rate aeration to keep FOG emulsified and prevent anaerobic souring in the tank. The same tank buffers temperature (pet food effluent can hit 55°C off the retort or cooker) and pH, both of which would otherwise knock the biology offline. On a 50 m³/d plant, that translates to roughly a 20–25 m³ EQ tank with a 1.5–2.2 kW mixer and 2–4 diffuser drops for aeration. Stainless wetted parts (304 or 316) are standard on a packaged plant because chloride pitting in the FOG-rich stream is a known failure mode.
FOG and TSS Removal With Dissolved Air Flotation
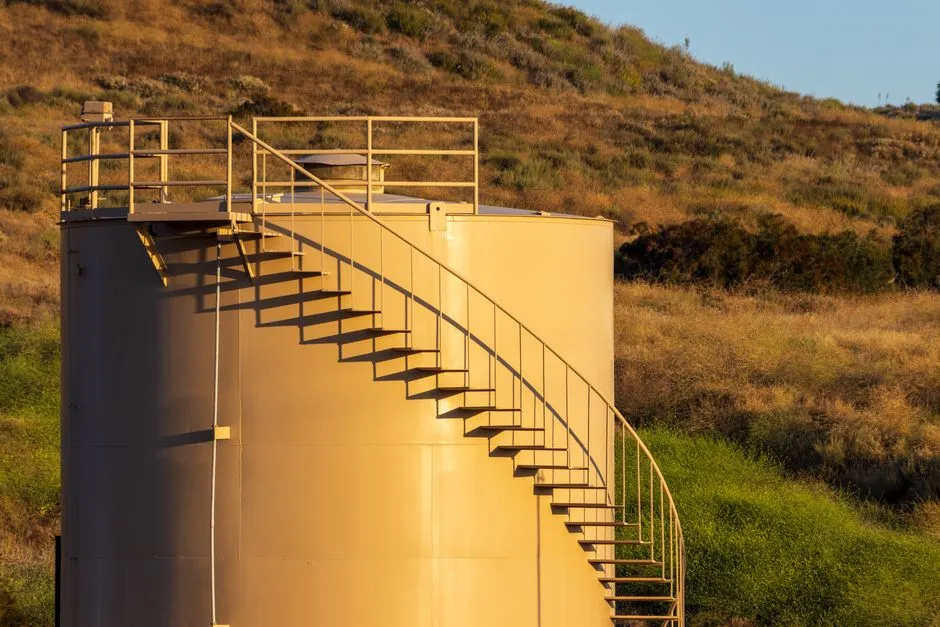
DAF is the workhorse step for FOG and TSS removal in food processing wastewater, and a 2026 design for a pet food plant should not skip it. A properly sized DAF cell delivers 85–95% FOG removal and 70–90% TSS removal at hydraulic loading 4–8 m/h and an air-to-solids ratio (A/S) of 0.02–0.05 (mass basis). Recycle rate is typically 20–30% of forward flow, which sets the saturation tank and recycle pump sizing. The unit is rated for the 25–40% peak flow band — the DAF must not be the bottleneck when the EQ tank spills during CIP.
Chemical conditioning is what makes those removals achievable. pH is adjusted to 6.5–7.5 with caustic or acid dosing, then 50–150 mg/L of polyaluminum chloride (PAC) is fed as coagulant, followed by 1–3 mg/L of anionic polyacrylamide as flocculation aid. A bench jar test on the actual plant effluent is the only defensible way to lock in dose rates; the ranges above are typical, not universal. An automatic chemical dosing system with flow-paced control is the standard 2026 setup, and the chemistry typically adds 12–18% to the OPEX line for the FOG removal stage.
Skipping DAF is false economy on a pet food plant. FOG coats MBR membranes, raises SVI in activated sludge, inhibits anaerobic methanogens in UASB reactors, and increases downstream chemical demand across the rest of the train. A HydropureWater DAF system for FOG and TSS removal sized to 25–40% of average flow is the standard first biological-protection step before any aerobic or anaerobic stage.
| DAF design parameter | Typical 2026 range | Notes |
|---|---|---|
| Hydraulic loading | 4–8 m/h | Higher end for FOG-rich treat/jerky streams |
| Air-to-solids ratio (A/S) | 0.02–0.05 | Set by jar test on site effluent |
| Recycle rate | 20–30% of forward flow | Sets saturation tank size |
| FOG removal | 85–95% | Down to 30–100 mg/L in effluent |
| TSS removal | 70–90% | Down to 100–500 mg/L in effluent |
| PAC dose | 50–150 mg/L | Adjust per jar test |
| Anionic PAM dose | 1–3 mg/L | 0.1–0.3% stock solution |
| pH window | 6.5–7.5 | Auto-dosed upstream of floc tube |
Biological Treatment: SBR, MBR, MBBR, or Anaerobic
The biological stage is where the design choice is made. Four configurations are realistic for a 2026 pet food plant in the 20–500 m³/d band, and the choice is driven by discharge limit, flow, available footprint, and whether biogas is wanted. The decision table below ties each option to its design parameters so the engineer can hand the numbers to a vendor without re-deriving them.
| Process | HRT | MLSS / biomass | Key loading or flux | Effluent COD | Footprint | CAPEX | Best fit |
|---|---|---|---|---|---|---|---|
| SBR | 18–24 h | 3,500–5,000 mg/L MLSS | F/M 0.05–0.15 kg BOD/kg MLSS·d | 60–90 mg/L | Medium | Low–medium | Flows <50 m³/d, batch operation, no membrane budget |
| MBR | 8–14 h | 6,000–10,000 mg/L MLSS | Flux 10–20 L/m²·h | <50 mg/L | Small | Medium | 50–200 m³/d, tight limits, reuse; default 2026 selection |
| MBBR | 12–20 h | Fill 40–60%, no recycle | Surface load 12–20 g BOD/m²·d | 80–120 mg/L | Medium | Low | Flows <50 m³/d, simple operation, less sludge handling |
| UASB (anaerobic) | 24–48 h | Granular sludge bed | OLR 5–10 kg COD/m³·d | 300–600 mg/L (post-aeration needed) | Small | High civil, low mech. | >500 m³/d, biogas offsets aeration power |
For new 50–200 m³/d pet food plants in 2026, MBR is the default when reuse or tight discharge limits apply. The 50 m³/d containerized biological plant deployed for Monogram's pet treat operation is the documented precedent (Xylem case study, 2025). An MBR wastewater treatment system running at HRT 8–14 h, MLSS 6,000–10,000 mg/L, and flux 10–20 L/m²·h delivers an effluent <50 mg/L COD, <10 mg/L TSS, and <5 mg/L NH₃-N after upstream DAF — enough to meet GB 8978-1996 Class I, US EPA 40 CFR Part 408 meat products limits, and EU UWWD 91/271/EEC discharge targets. The MBR membrane module and its replacement schedule are the largest single OPEX line on the biology side, which is why MBR OPEX benchmarks are the first thing a 2026 CAPEX-defending engineer should pull.
For flows under 50 m³/d, the membrane cost is harder to justify and SBR or MBBR is the realistic call. SBR is the workhorse for batch-operated treat and jerky plants where the upstream flow already arrives in slugs. MBBR is the right pick when the operator skill set is limited and the plant does not want to run a sludge recycle loop. For plants above 500 m³/d, anaerobic UASB followed by a post-aeration stage is the standard high-flow configuration: OLR 5–10 kg COD/m³·d, HRT 24–48 h, and biogas production of 0.35–0.45 m³ per kg COD removed offsets most of the aeration power, which is what makes OPEX competitive at scale. Aerobic design loadings to hand to a vendor are 0.2–0.5 kg BOD/m³·d; anaerobic loadings are 5–10 kg COD/m³·d. A membrane bioreactor module should be specified at design flux 10–15 L/m²·h for 2026 plants, with operating flux kept below 80% of the clean-water flux to manage fouling.
Tertiary Treatment, Disinfection, and Sludge Handling
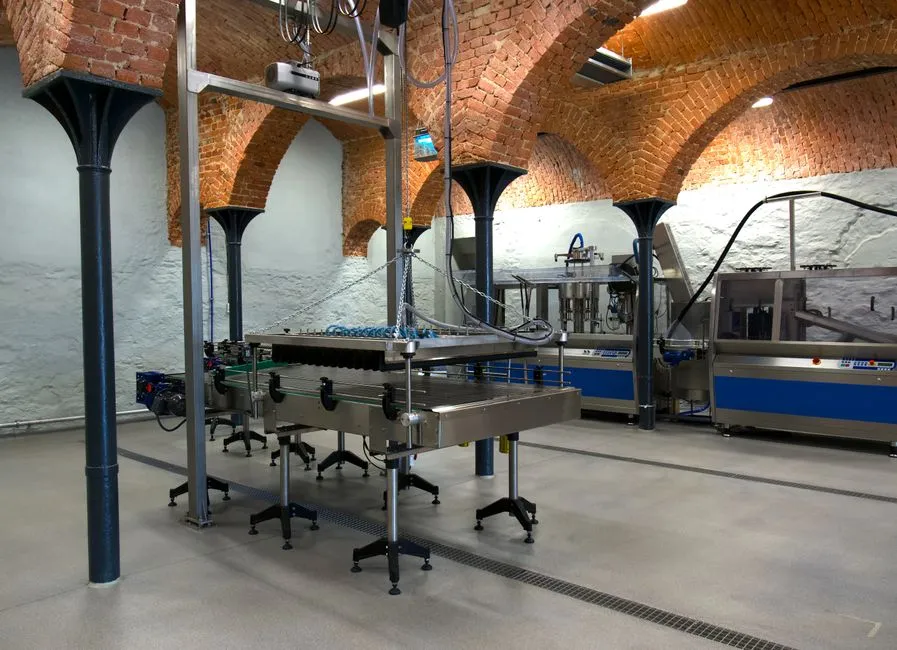
Tertiary polishing protects the disinfection step and the discharge permit. A lamella clarifier ahead of disinfection at surface loading 20–40 m/h removes another 60–80% of residual TSS and is the standard polish after MBR or SBR when the effluent is being reused or discharged to a sensitive receiving water. A high-efficiency sedimentation tank sized on hydraulic loading (not just volume) is the right call for 2026 plants. Operators running a 50 m³/d system that meets Class I reuse thresholds on a regular basis will not tolerate a clarifier that upsets on a flow peak.
Disinfection is on-site ClO₂ generation in the 50–10,000 g/h range, dosed at 2–5 mg/L residual with 15–30 min contact time. A chlorine dioxide generator handles the high organics that fail sodium hypochlorite, and it does not form trihalomethanes at the residual doses used in food plants. Sludge handling closes the train: a plate and frame filter press operating at 1.5–2.5 MPa with polymer conditioning targets cake dryness of 22–28% DS. DAF float and biological waste activated sludge are typically co-thickened in a holding tank ahead of the press, which keeps the press feed at 2–4% DS and the cycle time under 90 min. The cake is non-hazardous in most jurisdictions but should be sent for rendering or composting, not landfilled, because the FOG and protein load is too high for typical MSW landfills.
2026 CAPEX and OPEX Benchmarks
For a packaged 50 m³/d pet food effluent plant, total installed CAPEX in 2026 is USD 280–520k including DAF, MBR, ClO₂, sludge press, and control panel — anchored to the documented 50 m³/d Monogram reference plant (Xylem case study, 2025). The OPEX line runs USD 0.45–0.90 per m³ treated at 2026 energy prices, broken down as 35% energy, 20% chemicals, 25% sludge disposal, 15% labor, and 5% membrane replacement. The split is roughly 1.5–2.5× the OPEX of a comparable municipal plant because of the FOG-removal step, the stainless wetted parts, and the higher chemical doses; that delta is real and is the first number to defend in front of procurement.
| Cost line | 2026 range (USD, packaged 50 m³/d plant) | Notes |
|---|---|---|
| Total installed CAPEX | 280,000–520,000 | Includes headworks, DAF, MBR, ClO₂, press, controls |
| OPEX per m³ treated | 0.45–0.90 | At 2026 energy tariffs |
| Energy share of OPEX | 35% | Aeration + DAF recycle pump dominate |
| Chemical share of OPEX | 20% | PAC, PAM, NaOH, ClO₂ precursor |
| Sludge disposal share | 25% | Rendering or composting off-site |
| Labor share of OPEX | 15% | Skid packaged plants run 2–4 hr/day operator |
| Membrane replacement share | 5% | MBR modules at 4–6 yr life |
| Sensitivity to energy price | 1.4× in high-tariff regions | Flags OPEX exposure in 2026 procurement |
Compliance Checklist for 2026 Discharges
The design envelope above targets a final effluent of COD <50 mg/L, BOD <10 mg/L, TSS <10 mg/L, FOG <5 mg/L, and NH₃-N <5 mg/L. Map that to the three regulatory frames a 2026 pet food plant is most likely to face: China GB 8978-1996 Class I (COD 100, BOD 30, NH₃-N 15 mg/L one-day max), US EPA 40 CFR Part 408 meat products limits (BOD 5-day 25 mg/L, TSS 30 mg/L, FOG 10 mg/L monthly avg), and EU UWWD 91/271/EEC (COD 125, BOD 25, TSS 35 mg/L for discharges >10,000 PE). All three are reachable with the MBR + DAF train described above. Site-specific local permits vary widely by watershed, and the design must be confirmed against the actual discharge permit before any CAPEX is committed; do not size to a generic limit and assume the regulator will accept it.
Frequently Asked Questions
What COD, BOD, and FOG levels can a pet food plant expect?
3,000–12,000 mg/L COD, 1,500–6,000 mg/L BOD₅, and 200–2,000 mg/L FOG across the combined plant envelope, with FOG up to 2,000 mg/L on treat and jerky lines.
Is DAF always required before the biological stage?
Yes, on pet food effluent. FOG above roughly 200 mg/L coats MBR membranes, raises SVI in activated sludge, and inhibits UASB methanogens; DAF at 85–95% FOG removal is the standard 2026 pretreatment.
What is the typical daily flow per ton of finished pet food produced?
Roughly 1.5–4 m³ per ton of finished product for kibble lines, and 3–8 m³ per ton for wet and treat lines; site CIP and rendering washwater dominate the envelope.
What is the design HRT for an SBR vs an MBR on pet food effluent?
SBR at HRT 18–24 h with MLSS 3,500–5,000 mg/L and F/M 0.05–0.15; MBR at HRT 8–14 h with MLSS 6,000–10,000 mg/L and flux 10–20 L/m²·h.
How much space does a 50 m³/d packaged plant need?
A 50 m³/d packaged plant fits in a 60–90 m² skid or containerized footprint for the biological stage, with an additional 30–50 m² for DAF, EQ, and sludge handling; total installed footprint is typically 120–180 m² including access and chemical dosing skids. The Xylem case study at Monogram (2025) is the documented precedent for this configuration.