What Makes Display Panel Wastewater Different from Generic Industrial Effluent
Display panel wastewater treatment is a multi-stream process designed for LCD, OLED, and TFT-LCD fabs, where Array, Color-Filter, Cell, and Module lines each generate chemically distinct effluents containing fluorides (HF, NH4F), stripper organics (TMAH, NMP, DMSO), abrasive slurry (CeO2, SiO2), acids, and IPA. A 2026 typical train combines pH balancing, DAF for slurry, Fenton/oxidation for COD, calcium precipitation for fluoride, MBR polishing, and RO for reuse — sized for 2,000–10,000 m³/d with CAPEX of USD 3M–18M. Generic semiconductor or municipal trains fail on this effluent because panel fabs produce four streams simultaneously that are chemically incompatible: a low-pH fluoride stream from Array etching, a high-pH TMAH/NMP stream from Cell stripping, a resist-laden slurry stream from Color-Filter, and a low-TDS IPA stream from Module — blending them upstream destroys any single downstream unit operation.
The fab architecture is the first design constraint. Array (TFT deposition, photolithography, dry/wet etch) generates HF, BOE, H2SO4, H2O2, and NH4F. Color-Filter (resist coat, exposure, develop) generates resist-derived organics, CeO2/SiO2 slurry, and developer solvents. Cell (PI printing, spacer spray, bonding) generates TMAH, NMP, DMSO, and stripper organics. Module (polarizer, ACF, driver IC attach) generates IPA, acetone, and trace flux. These four chemical families — acids/alkalis, organics, fluorides, and abrasive slurry — must be addressed in the unit-operation design, and each stream must be either treated separately or routed through carefully sized equalization tanks before blending.
Design in 2026 anchors to GB 39731-2020: COD ≤ 100 mg/L and fluoride ≤ 8 mg/L for flat-panel display fabs in China (per the standard's Table 2 flat-panel category, 2025-12 revised thresholds). Municipal plants have no fluoride limit and accept 50 mg/L COD — a 2× looser organics bar — so a municipal train cannot be repurposed. Flow is also non-steady: wet-bench dumps cause 3–5× peak-to-average swings, and equalization tanks must be sized for 8–12 hours of average flow to damp the hydraulic shock before downstream biological and membrane steps.
Mapping Each Panel-Fab Stream to the Right Unit Operation
Array wastewater is characterized by COD 100–500 mg/L, F⁻ 50–500 mg/L, and pH 1–3. The proven 2026 train is pH equalization to 6.5–8.5 → CaCl2 precipitation for F⁻ → Fenton oxidation for residual COD → neutralization → DAF system for slurry and color-filter wastewater pre-treatment for floated solids → blending with equalized Cell stream for biological polishing. Sending Array wastewater to MBR first is a common 2025-era mistake: residual fluoride at 20–50 mg/L fouls PVDF membranes within 30 days, and Fenton must precede the membrane step.
Color-Filter wastewater is resist-dominated, with COD 500–2,000 mg/L and SS 200–1,000 mg/L. The 2026 baseline is Fenton + DAF in series; do not send CF wastewater to MBR first because particulate resist (50–200 µm flocs) blinds flat-sheet membranes within 14 days (HydropureWater field data, 2026). DAF with 50–150 mg/L polyaluminum chloride (PAC) coagulant cuts SS to <100 mg/L and removes 40–60% of the particulate COD before Fenton.
Cell wastewater is the hardest stream: TMAH 500–5,000 mg/L, NMP 1,000–10,000 mg/L, pH 10–13. Separate collection is mandatory because TMAH and NMP at this load will shock a generic MBR — the biological inhibition threshold for TMAH sits at 800–1,200 mg/L for conventional activated sludge. Biological stripping (air-stripping at pH >11) + Fenton polishing is the 2026 mainstream path; wet air oxidation (WAO) is emerging for fabs with TMAH >3,000 mg/L. Module wastewater (IPA, acetone, trace organics, low TDS <500 mg/L) is the simplest stream: biological + DAF handles it, and it can be blended with Cell stream after equalization. Slurry wastewater with SS 500–5,000 mg/L CeO2/SiO2 routes to DAF first; ultrafiltration polishes to <10 mg/L if water reuse is targeted.
| Stream | COD (mg/L) | F⁻ (mg/L) | SS (mg/L) | pH | Primary unit operation | Effluent target (mg/L) |
|---|---|---|---|---|---|---|
| Array | 100–500 | 50–500 | <200 | 1–3 | CaCl2 precipitation + Fenton | COD ≤ 100, F⁻ ≤ 8 |
| Color-Filter | 500–2,000 | <10 | 200–1,000 | 6–9 | DAF + Fenton | SS < 100, COD ≤ 100 |
| Cell (PI stripper) | 2,000–10,000 | <5 | <100 | 10–13 | Air-strip + Fenton or WAO | COD ≤ 100 |
| Module | 200–800 | <2 | <50 | 6–9 | Bio + DAF | COD ≤ 100 |
| Slurry | 100–300 | <2 | 500–5,000 | 6–8 | DAF (PAC) + UF polish | SS < 10 |
Module and Cell streams blend for biological polishing through a submerged MBR for organic polishing; the MBR handles organics polishing only, never raw TMAH destruction.
The 2026 Reference Process Flow for a 2,000–10,000 m³/d Display Fab
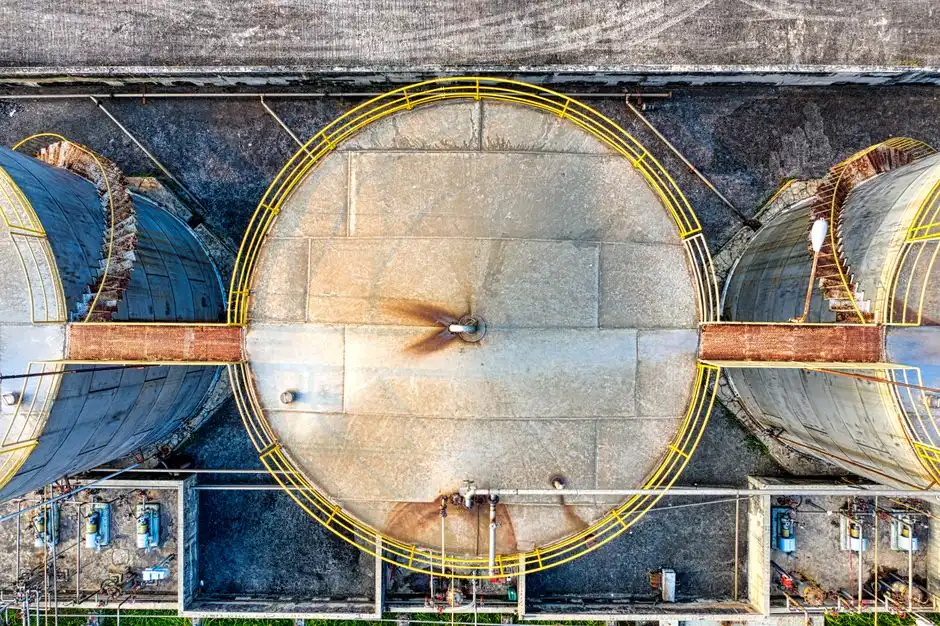
The 2026 reference train in execution order: inlet works → stream segregation → fluoride precipitation → Fenton/WAO → DAF → MBR → RO reuse. Inlet works starts with a rotary bar screen for inlet works at 5 mm opening to handle wafer-broken-glass fragments from Cell bonding, followed by equalization tanks sized for 8 h average flow with mechanical mixing at 20–30 W/m³ to keep slurry in suspension. Automated chemical dosing for pH and fluoride control brings the blended stream to pH 6.5–8.5 via HCl/NaOH dosing with redundant metering pumps.
Stream segregation is non-negotiable. Fluoride streams go to a dedicated precipitation reactor with CaCl2 dosed at 1.5–2.0× stoichiometric; TMAH/NMP streams go to a dedicated equalization with air-stripping; slurry streams go to DAF first. Streams blend for biological polishing only after segregated targets are met. The biological step is a submerged MBR with 0.1 µm PVDF flat-sheet membranes operating at 10–20 L/m²·h flux, footprint 60% smaller than conventional activated sludge per the integrated MBR spec covering 10–2,000 m³/d units (HydropureWater engineering data, 2026).
Fluoride polishing uses lamella clarifier after fluoride precipitation at 4–6 m/h overflow rate, with ion-exchange resin polish if the reuse target is <1 mg/L F⁻. The reuse step is RO polishing for fab water reuse at 70–85% recovery and >95% salt rejection — effluent meets UPW-grade pre-treatment for non-critical rinse reuse, cutting fresh-water intake 40–60%. For fabs co-located with adjacent cell lines, a parallel zero liquid discharge design for adjacent PV cell fabs can be referenced for high-recovery reuse economics.
Removing TMAH and NMP: Fenton vs Wet Oxidation vs MBR Polishing
TMAH destruction is the single largest CAPEX decision in a 2026 panel-fab WWTP. Fenton oxidation (H2O2/Fe²⁺ at pH 3–4, H2O2:COD mass ratio 1.5–2.0) delivers 60–80% COD removal at CAPEX USD 200K–600K for a 1,000 m³/d Cell stream, and it works for TMAH <1,000 mg/L. Wet air oxidation (WAO) or supercritical oxidation delivers 90–99% COD removal at CAPEX USD 1.5M–4M and is required when TMAH >3,000 mg/L — the 2026 norm at Gen-8.5+ fabs running large PI stripper volumes with NMP co-stripping.
MBR polishing alone is not enough. TMAH at 2,000 mg/L exceeds biological inhibition thresholds (IC50 ≈ 800–1,200 mg/L for heterotrophic bacteria per standard respirometry data, 2025-09) and needs an upstream destruction step. Position MBR as the polishing unit, not the primary removal. The decision rule: pick Fenton if TMAH influent <1,000 mg/L and the goal is discharge; pick WAO or supercritical if the goal is reuse, or if TMAH >3,000 mg/L.
| Technology | COD removal (%) | TMAH influent cap (mg/L) | CAPEX, 1,000 m³/d (USD M) | OPEX, 1,000 m³/d (USD/yr) | Best fit |
|---|---|---|---|---|---|
| Fenton (H2O2/Fe²⁺) | 60–80 | 1,000 | 0.2–0.6 | 150K–300K | Discharge, TMAH < 1,000 mg/L |
| Wet air oxidation (WAO) | 90–95 | 5,000 | 1.5–3.0 | 300K–500K | Reuse, TMAH 1,000–5,000 mg/L |
| Supercritical oxidation | 95–99 | 10,000+ | 2.5–4.0 | 400K–700K | High-load, ZLD-adjacent |
| MBR polishing alone | 20–40 | 800 (inhibition) | 0.5–1.2 | 80K–150K | After Fenton or WAO only |
For fabs considering large-scale biological polishing, see the MBR market and vendor selection guide, and for RO reuse economics the industrial reuse and desalination market context puts the 9% CAGR and 2026 pricing baseline into frame.
Fluoride Removal Chemistry and 2026 Discharge Limits
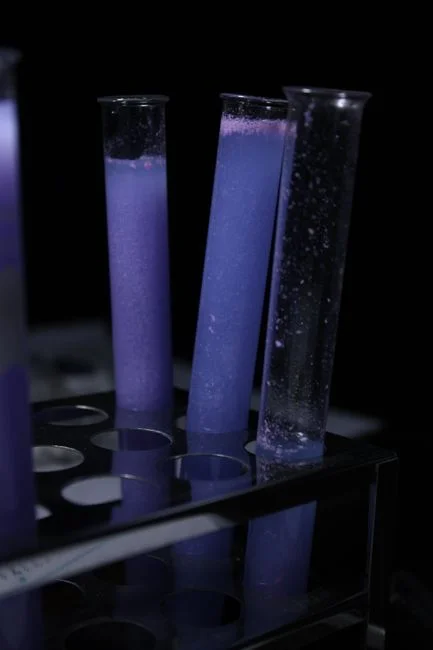
Calcium precipitation with CaCl2 is the 2026 workhorse for fab fluoride streams. The stoichiometry is 1 mole Ca²⁺ per 2 moles F⁻ to form CaF2 (Ksp = 3.9 × 10⁻¹¹), but in practice the dose is set at 1.5–2.0× stoichiometric to overcome complexation by BOE additives and to hit the 8 mg/L ceiling. Underdosing misses the limit; overdosing wastes chemical and fouls downstream RO with CaF2 carryover and CaSO4 scaling.
The typical 2026 fluoride trajectory is 50–500 mg/L influent → 8–15 mg/L after Ca precipitation → 1–3 mg/L after a lamella clarifier at 4–6 m/h → <0.5 mg/L after ion-exchange resin polish (strong-base anion resin, 40–60 BV throughput before regeneration). 2026 limits to design to: China GB 39731-2020 ≤ 8 mg/L; Taiwan EPA semiconductor effluent standard ≤ 15 mg/L; Korea semiconductor guidelines typically 5–10 mg/L; EU BAT-AEL for surface treatment typically 2–10 mg/L depending on flow. For a deeper cross-jurisdictional view, the global fluoride discharge limits and treatment options article maps every fab-relevant standard.
2026 CAPEX and OPEX Bands for a Display Fab Sidestream WWTP
For a 2,000 m³/d reference plant in 2026 USD, the CAPEX breakdown is: civil/equalization USD 0.5–1.5M; DAF + Fenton USD 0.6–1.5M; MBR USD 0.5–1.2M; RO reuse USD 0.8–2.0M; fluoride precipitation USD 0.4–1.0M; instrumentation/SCADA USD 0.3–0.8M — total USD 3M–8M. Large fabs at Gen-8.5+ with 10,000 m³/d and full water reuse push CAPEX to USD 12M–18M because of the WAO step (USD 1.5M–4M alone) and double-pass RO required to meet UPW feed specifications.
OPEX is dominated by chemicals (30–35%) and energy (25–30%), with sludge disposal and membrane replacement making up the balance. Reagent recovery can shift the OPEX curve: CaF2 byproduct has a small but real market value (USD 50–80/tonne as a metallurgical flux, 2026-01 spot pricing), and RO concentrate volume reduction through selective ion-exchange can cut waste disposal 30–40%, recovering 10–20% of total OPEX for high-flow fabs.
| Line item | 2,000 m³/d fab (USD M) | 10,000 m³/d fab with reuse (USD M) | % of total at 2,000 m³/d |
|---|---|---|---|
| Civil works + equalization | 0.5–1.5 | 2.0–3.5 | 15–20% |
| DAF + Fenton | 0.6–1.5 | 2.0–3.5 | 20–25% |
| MBR biological polishing | 0.5–1.2 | 1.5–2.5 | 15–18% |
| RO reuse skid | 0.8–2.0 | 3.0–4.5 | 22–28% |
| Fluoride precipitation + clarifier | 0.4–1.0 | 1.0–2.0 | 10–15% |
| WAO (Gen-8.5+ only) | n/a | 1.5–4.0 | 0% (small fab) / 15–25% (large fab) |
| Instrumentation / SCADA | 0.3–0.8 | 0.8–1.5 | 8–10% |
| Total | 3.0–8.0 | 12.0–18.0 | 100% |
Frequently Asked Questions
What is the typical flow rate of wastewater from a Gen-8.5 LCD fab? 5,000–10,000 m³/d, with peak-to-average swings of 3–5× driven by wet-bench dumps. Equalization tanks should be sized for 8–12 h of average flow to damp hydraulic peaks before downstream biological and membrane steps.
Which 2026 standard applies to flat-panel display fab effluent in China? GB 39731-2020 sets COD ≤ 100 mg/L and fluoride ≤ 8 mg/L for the flat-panel display category (per Table 2, 2025-12 revised thresholds). The standard also sets pH 6–9 and ammonia ≤ 10 mg/L for the same category.
Can MBR alone handle TMAH from a PI stripper stream? No. TMAH at 500–5,000 mg/L exceeds biological inhibition thresholds (IC50 ≈ 800–1,200 mg/L for heterotrophic bacteria). Fenton, wet air oxidation, or supercritical oxidation must precede MBR polishing; MBR handles the residual COD polish, not the primary TMAH destruction.
How much water can a 2026 display fab recycle with RO? 40–60% of total fab water demand when RO polish is added after MBR, depending on whether the reuse target is non-critical rinse (single-pass RO at 70–85% recovery) or UPW feed (double-pass RO at 60–70% recovery, additional mixed-bed polish). The 2026 industry benchmark is 45–55% reuse for a Gen-8.5 LCD fab with full RO polish.
What is the biggest CAPEX line item in a display fab WWTP? TMAH/NMP destruction (WAO or supercritical) and RO reuse, which together account for 35–50% of the 2026 total project cost. For a 10,000 m³/d Gen-8.5+ fab, WAO alone is USD 1.5M–4M and double-pass RO is USD 3.0M–4.5M.