Why Food Processing Plants Need IoT Wastewater Sensors in 2026
Food-processing wastewater is fundamentally different from municipal sewage, and that difference is what makes continuous monitoring non-negotiable in 2026. A typical food plant discharging 500–2,000 m³/d generates effluent with BOD 1,000–10,000 mg/L, COD 2,000–20,000 mg/L, FOG 200–3,000 mg/L, TSS 500–4,000 mg/L, pH swinging between 4 and 11, and temperatures of 25–45 °C — swings driven by clean-in-place (CIP) cycles, batch discharges, and seasonal product changeovers. Manual composite sampling, usually one 24-hour pull per shift, cannot resolve excursions shorter than 6–12 hours, yet most 2026 discharge permits require BOD below 30–50 mg/L and FOG below 10–50 mg/L at the outfall. When a fat-rich CIP slug pushes FOG above the limit for a single 4-hour window, the resulting Notice of Violation typically carries a $50,000–$200,000 penalty under most U.S. NPDES and EU IED frameworks, before the cost of corrective sludge disposal is counted.
Online instrumentation closes that detection gap and protects the pre-treatment chain. A dissolved air flotation system installed ahead of the biological stage removes 70–90% of FOG and TSS before the water reaches the sensor network, dramatically reducing fouling and extending the calibration interval on every downstream probe. Plants that have instrumented the floatate, the DAF effluent, and the final outfall report 60–80% fewer manual sample runs and a documented 15–30% reduction in coagulant and polymer consumption once sensor feedback drives the dosing pumps.
The Six Parameters a Food Plant Must Monitor in Real Time
Building a sensor bill of materials by parameter, not by brand, is the specification approach that survives the procurement review. Six parameters cover more than 90% of compliance and process-control decisions on a food line.
- pH (0–14, ±0.02 accuracy): glass electrodes remain the low-cost workhorse, but ISFET and differential pH probes survive the pH 2–12 swings of CIP streams where glass reference junctions fail within weeks. Response time 10–30 seconds; replaces EPA 150.1 / ISO 10523 grab methods.
- COD/BOD: UV-Vis absorbance at 254 nm correlates to COD across 0–10,000 mg/L with ±5% accuracy once site-calibrated; BOD is increasingly inferred from fluorescence/luminescence probes in the 0–500 mg/L range, replacing the 5-day BOD₅ test (EPA 405.1). Response time 30–60 seconds for UV-Vis, 5–15 minutes for fluorescence.
- FOG (0–2,000 mg/L, ±2% FS): UV fluorescence at 320–400 nm and NIR scattering between 850–1,550 nm now replace the labor-intensive EPA 1664 hexane partition method. Solvent extraction is being retired because it cannot feed a closed-loop polymer dosing signal. Deeper technology comparison is in the online oil and grease sensor buyer's guide.
- Ammonia nitrogen: ion-selective electrodes cover 0.1–1,000 mg/L NH₃-N with ±3% accuracy; gas-sensing Severinghaus probes drift less in high-FOG streams but cost 30–50% more. Replaces EPA 350.1 with a 30–60 second response. ISE versus colorimetric tradeoffs are detailed in the online ammonia nitrogen analyzer guide.
- Conductivity/TDS (0–50,000 µS/cm) and TSS (0–10,000 mg/L, optical NIR): four-electrode conductivity probes tolerate coating better than two-electrode designs; optical NIR TSS probes replace EPA 160.2 with a 10–30 second response and survive food-plant CIP temperatures to 80 °C.
- Dissolved oxygen (0–20 mg/L) and temperature (−5 to +80 °C): luminescent DO probes have largely replaced galvanic/membrane types in food plants because they tolerate CIP steam and require no electrolyte refill. Both signals feed MBR aeration control.
Sensor Technology Choices and Food-Industry Caveats

Fouling is the single largest reason online sensors fail in food plants. Cleaning intervals that average 30 days on municipal duty drop to 5–10 days in a high-FOG, high-TSS food matrix unless the probe carries an automatic air-wipe or ultrasonic cleaner — a hard requirement, not an option, above 2,000 mg/L TSS. Optical sensors (UV-Vis COD, NIR TSS, fluorescence FOG) are non-contact and reagent-free, but their windows foul within 48–72 hours in a DAF feed stream without an auto-clean cycle; plan for 3–5% of probe CAPEX per year on cleaning consumables. Electrochemical sensors (pH, NH₃-N ISE, DO membrane) are accurate to ±0.02 pH and ±0.05 mg/L DO but drift faster in high-FOG streams; differential pH and gas-sensing ammonia probes extend service life from weeks to months in CIP-heavy service.
Temperature compensation is non-negotiable: specify probe electronics rated to 60 °C minimum, and 80 °C if the sensor sits on a hot CIP return line. Installation geometry matters as much as sensor choice. Submersible probes are cheapest and suit equalization basins; in-pipe insertion probes work on pumped lines with >1.5 m/s velocity to keep the optical window clean; side-stream (bypass) loops with self-cleaning filters are the correct choice for high-TSS or high-FOG feeds because they protect the optical surface and isolate the instrument from pump cavitation. Use the decision rule: TSS <500 mg/L and FOG <200 mg/L permits in-pipe; above those thresholds, specify a bypass loop with a 100–200 µm filter and a return-to-process tap.
| Installation Mode | Typical Use | TSS/FOG Limit | Cleaning Interval (Food) |
|---|---|---|---|
| Submersible | Equalization basin, final outfall | TSS < 1,000 mg/L | 14–21 days |
| In-pipe insertion | Post-DAF, post-MBR effluent | TSS < 500 mg/L, FOG < 200 mg/L | 21–30 days |
| Side-stream bypass | Raw influent, DAF feed, CIP return | No practical limit with filtration | 5–10 days without auto-clean |
Parameter-to-Sensor Selection Matrix
The matrix below maps the six core parameters to the technology, range, accuracy, and food-specific caveat a 2026 buyer should require in writing. Mounting location is called out as a separate column because food-plant hydraulics — not the sensor datasheet — drive where fouling risk is lowest.
| Parameter | Recommended Technology | Range | Accuracy | Mounting Location | Food-Plant Caveat |
|---|---|---|---|---|---|
| pH | Differential electrode (glass + reference) | 0–14 | ±0.02 pH | Post-DAF, pre-MBR | Standard glass fails in CIP pH 2/12 swings |
| COD | UV-Vis 254 nm | 0–10,000 mg/L | ±5% FS | Post-DAF, final effluent | Site correlation required; auto-clean mandatory |
| BOD / BOD-equivalent | Fluorescence / luminescence | 0–500 mg/L | ±0.5 mg/L or 5% | Pre-MBR (aeration tank) | Quenching from turbidity; pair with TSS compensation |
| FOG | UV fluorescence | 0–2,000 mg/L | ±2% FS | Pre-DAF (raw), post-DAF (polish) | Solvent extraction obsolete for online duty |
| NH₃-N | ISE or gas-sensing | 0.1–1,000 mg/L | ±3% FS | Pre-MBR, final effluent | ISE drift; gas-sensing tolerates FOG |
| TSS | Optical NIR (90° scatter) | 0–10,000 mg/L | ±5% FS | Post-DAF, post-MBR | Lens fouling; ultrasonic or air-wipe required |
| Conductivity | 4-electrode toroidal | 0–50,000 µS/cm | ±1% FS | Post-DAF, final effluent | Coating tolerant; useful for CIP detection |
| DO / Temperature | Luminescent DO, RTD | 0–20 mg/L / −5 to +80 °C | ±0.1 mg/L / ±0.2 °C | MBR aeration basin | Luminescent type survives CIP steam |
The 4–20 mA signals from these probes terminate at a HydropureWater PLC-controlled chemical dosing skid, which trims polymer and coagulant setpoints in real time based on FOG and TSS trends.
IoT Communication Architecture: From Sensor to SCADA to Cloud
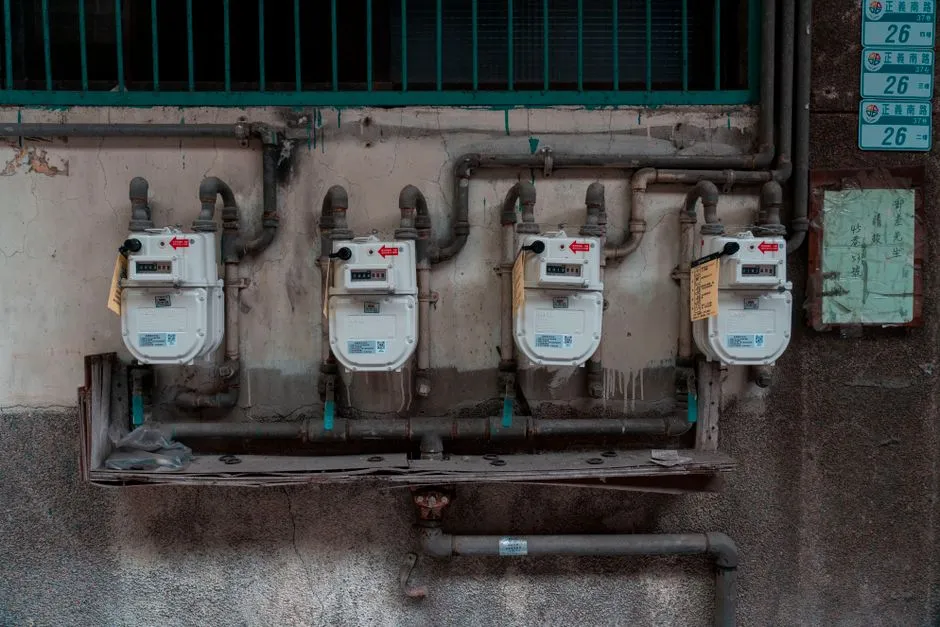
Field layer communication in 2026 is still dominated by 4–20 mA + HART on brownfield food lines because the wiring exists and the technicians know it. New construction should default to Modbus RTU over RS-485 for clusters of 4–10 sensors, and Modbus TCP for greenfield sites where Ethernet backhaul is available — both convert cleanly to MQTT at the edge gateway. An industrial edge gateway buffers 24–72 hours of tag history locally so audit traceability is preserved when the plant network drops, then publishes to either MQTT (AWS IoT Core, Azure IoT Hub) for cloud dashboards or OPC UA (Siemens WinCC, Emerson iFIX, Inductive Automation Ignition) for the SCADA HMI. IEC 62443 zone-and-conduit segmentation is increasingly a 2026 food-plant audit finding: keep sensors on a Level 1 OT VLAN, expose only the SCADA server to the IT network, and never punch a sensor directly to the public internet.
Cybersecurity is now a board-level concern following 2025–2026 ransomware incidents at major food manufacturers that cost operators an estimated $10M–$50M per event in downtime and recovery. Role-based access, signed firmware, and OT/IT network separation should be specified at the procurement stage, not retrofitted after an incident.
| Layer | Protocol | Typical 2026 Use | Food-Plant Note |
|---|---|---|---|
| Field | 4–20 mA + HART | Brownfield retrofit | Still dominant; one tag per pair |
| Field | Modbus RTU (RS-485) | Common 2026 retrofit | Up to 32 devices per trunk |
| Field | Modbus TCP | Greenfield, Ethernet backhaul | Easier firewalling than RTU |
| Edge | Industrial gateway | Protocol conversion + buffering | 24–72 h local buffer for audits |
| Cloud / SCADA | MQTT | Cloud ingestion (AWS, Azure) | TLS 1.3 mandatory |
| Cloud / SCADA | OPC UA | SCADA (WinCC, iFIX, Ignition) | IEC 62443 compliant option |
2026 CAPEX and OPEX Ranges for Food-Plant IoT Networks
Numbers below are 2026 U.S. dollar ranges for a typical food-plant influent/effluent monitoring network; site-specific factors (explosion-proofing, hot-CIP rating, redundant gateways) can push individual line items 20–40% higher. Use these as procurement ammunition, not as a fixed quote.
| Item | 2026 CAPEX Range (USD) | Annual OPEX (% of CAPEX) |
|---|---|---|
| pH / conductivity probe + transmitter | $1,500–$4,000 | 10–15% |
| Optical COD / BOD analyzer | $8,000–$18,000 | 8–12% |
| UV-fluorescence FOG sensor | $12,000–$25,000 | 10–12% |
| NH₃-N ISE / gas-sensing probe | $6,000–$12,000 | 10–15% |
| NIR TSS probe | $5,000–$10,000 | 8–10% |
| Edge gateway + cloud platform (per site) | $8,000–$30,000 | 5–8% |
| Complete 10-sensor network, single line | $80,000–$250,000 | 8–12% combined |
The dominant OPEX line items are reagent cartridges (colorimetric analyzers, where still used), calibration buffers, probe replacement parts, and gateway cellular/data fees. Typical ROI driver is the 15–30% polymer and coagulant saving from closed-loop DAF dosing, plus the avoidance of a single $50,000–$200,000 non-compliance event. Most food plants reach payback in 12–24 months once a HydropureWater MBR membrane bioreactor is added to the controlled loop, because membrane aeration responds directly to NH₃-N and DO trends.
Integration Roadmap: From Standalone Sensors to Closed-Loop Plant Control
A phased rollout avoids the most common failure mode: trying to do everything in a single CAPEX cycle and ending up with a sensor network no one trusts.
- Phase 1 (0–3 months) — Monitoring only: install sensors on the DAF influent, DAF effluent, MBR effluent, and final outfall. Log data to SCADA, alarm on threshold breach, and have operators respond manually. This phase establishes the baseline and the calibration cadence.
- Phase 2 (3–9 months) — Trending and dosing control: wire the FOG and TSS signals into the polymer pump VFD on the DAF, and the pH signal into the coagulant dosing skid. Setpoint trim becomes automatic; expect a 10–20% polymer reduction within the first 90 days.
- Phase 3 (9–18 months) — Full closed-loop and predictive maintenance: add NH₃-N and DO control to the MBR aeration blower VFDs, and feed 12+ months of trend history into an ML/LSTM layer for aeration and CIP forecasting. Typical result is a 10–20% energy saving and the 15–30% chemical saving the business case was built on. The architecture for that ML layer is detailed in the AI process control for wastewater plants engineering guide.
Frequently Asked Questions
How many IoT sensors does a typical food-processing wastewater plant need in 2026? A single food line with DAF pre-treatment and MBR biological treatment typically deploys 8–15 sensors covering pH, conductivity, COD, BOD/FOG, NH₃-N, TSS, DO, and temperature, mounted at pre-DAF, post-DAF, pre-MBR, post-MBR, and final-effluent sample points (HydropureWater field data, 2026).
What is the biggest cause of sensor failure in food-plant wastewater service? Fouling from FOG, fat, and CIP residue is the leading failure mode, typically shortening the cleaning interval from 30 days on municipal duty to 5–10 days on food duty unless an automatic air-wipe or ultrasonic cleaner is specified.
Which IoT communication protocol should a 2026 food plant default to? For brownfield sites with existing 4–20 mA wiring, retain HART and add Modbus RTU over RS-485 for new clusters; for greenfield builds, specify Modbus TCP at the field layer, MQTT (TLS 1.3) for cloud ingestion, and OPC UA for SCADA integration with IEC 62443 zone segmentation.
What does a 10-sensor IoT network cost in 2026? Expect CAPEX of $80,000–$250,000 for a single food line, with OPEX at 8–12% of CAPEX per year; typical payback is 12–24 months through 15–30% polymer/coagulant savings and avoidance of a single $50K–$200K non-compliance event.
Can a frozen-food or high-CIP plant run the same sensor network as a beverage plant? The sensor selection is similar, but frozen-food lines with hot CIP return should specify probe electronics rated to 80 °C and add a side-stream bypass with filtration; MABR-based treatment is increasingly specified for this duty and is covered in the MABR for frozen food wastewater engineering guide, with primary clarification typically handled by an inclined-plate settler for food processing.