What Makes Soft Drink Wastewater Different
Soft drink wastewater is a sugary, low-toxicity, high-strength stream that responds well to biological treatment but punishes undersized equalization. Per the SSI Aeration industry definition, soft drinks cover any nonalcoholic, non-tap-water beverage: carbonated soft drinks, juice drinks, sports and energy drinks, bottled water, and ready-to-drink teas. Inside a bottling plant, four streams converge at the WWTP headworks: the syrup room (sugar and concentrate losses), the bottle and can washer (cleaning-in-place chemicals and label residue), filling-line spillage (product giveaway during changeovers), and floor wash (sugar + lubricant + detergent). Sugar-based recipes push the BOD₅/COD ratio to 0.5–0.7, which is high enough that the stream is fully biodegradable — but the same sugar load makes the wastewater volume-sensitive: a 10% syrup spill can double influent COD within an hour. Production seasonality is the second defining feature: summer runs in carbonated and sports-drink lines routinely swing daily flow 2–3× over winter baselines, so the equalization basin typically needs 12–24 hours of hydraulic retention to keep downstream biology on a stable F/M ratio.
Influent Characterization: Typical 2026 Benchmarks
Soft drink manufacturing wastewater is defined by high chemical oxygen demand with relatively low toxicity, as documented in the 2015 ozone + aerobic SBR bench-scale study (ResearchGate, 2015-11). Before sizing any unit operation, the engineer should compare the plant's own 24-hour composite sampling against the parameter ranges below.
| Parameter | Typical range | Peak (design) | Primary source |
|---|---|---|---|
| pH | 5.0–9.0 | 4.0–11.0 (CIP events) | Acid/caustic CIP, syrup spills |
| COD | 3,000–7,000 mg/L | 10,000 mg/L | Sugar syrup, juice concentrate |
| BOD₅ | 1,500–4,500 mg/L | 6,000 mg/L | Same as COD; BOD/COD 0.50–0.70 |
| TSS | 200–500 mg/L | 800 mg/L | Label pulp, bottle fragments, fruit pulp |
| Oil & grease | 50–150 mg/L | 200 mg/L | Lubricants, CIP defoamer |
| Total sugar | 500–2,500 mg/L | 5,000 mg/L | Sucrose, fructose, glucose |
| TKN | 10–40 mg/L | 80 mg/L | Limited; mostly from amino acids in juices |
| Total phosphorus | 5–20 mg/L | 40 mg/L | Phosphoric acid in cola formulations |
| Color | Light to dark amber | Opaque (cola, juice) | Caramel, fruit concentrate |
The pH swing is the single most damaging parameter for downstream biology: a 4.0 acid-CIP slug or 11.0 caustic-CIP slug arriving at the aeration tank will knock MLSS off a usable F/M ratio for 6–12 hours. Treat the equalization basin as a pH correction and load-smoothing asset, not just a flow buffer.
Process Train Design: Screening to Polishing
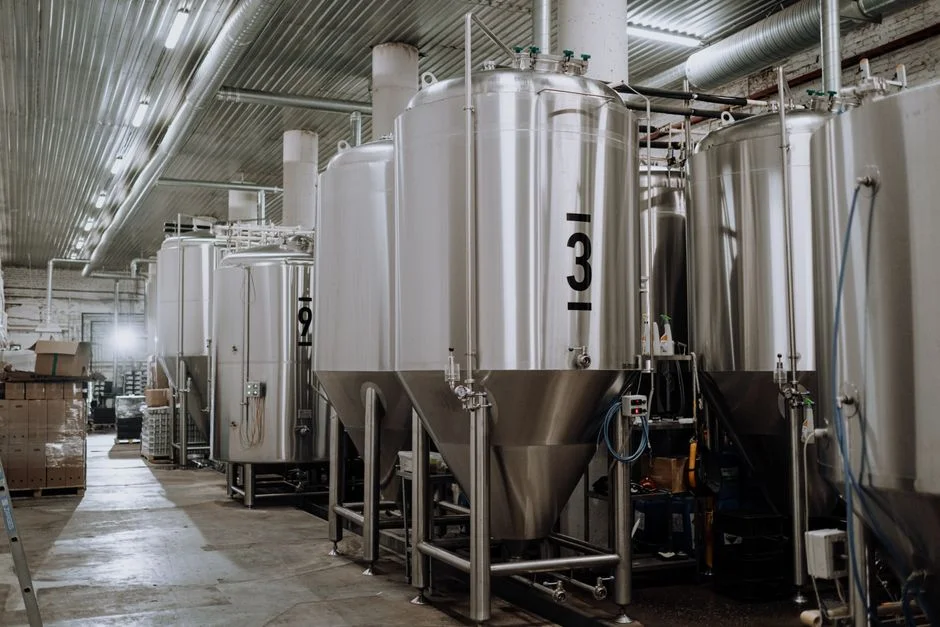
A 2026 soft drink WWTP runs as a six-step train. Each stage has a defined hydraulic retention time (HRT) and a removal target the engineer can audit against operating data.
| Step | Unit operation | HRT / loading | Design removal |
|---|---|---|---|
| 1 — Headworks | Rotary bar screen | 1–3 mm aperture | Removes labels, caps, fibrous debris |
| 2 — Equalization | EQ basin + pH correction | 8–24 hr HRT | Dampens 2–3× diurnal and seasonal peaks; stabilizes pH 6.5–8.0 |
| 3 — Primary clarification | DAF (dissolved air flotation) | A/S 0.02–0.06; 20–40 min HRT | 70–90% FOG; 50–70% TSS |
| 4 — Biological | Aerobic SBR or MBR | HRT 18–30 hr; MLSS 3,000–5,000 mg/L; F/M 0.15–0.35 kg BOD/kg MLVSS·d | >95% COD; effluent <50 mg/L COD (MBR) |
| 5 — Polishing | Multi-media filter or membrane | 10–15 m/h filtration rate | TSS <10 mg/L (reuse-grade) |
| 6 — Disinfection | Chlorine dioxide (ClO₂) | 2–5 mg/L dose; 30 min contact | Fecal coliform <200 CFU/100 mL |
At headworks, a rotary bar screen for headworks protection at 1–3 mm aperture catches the label and cap debris that routinely fouls downstream pumps. The equalization basin follows; sizing it for 8–24 hours is the single most cost-effective decision in the train because it flattens both the diurnal 2–3× swing and the seasonal 2× swing without over-aerating the biological stage. A DAF system for oil/grease and floatable solids removal takes out 70–90% of the FOG and 50–70% of TSS before biology, which keeps the biomass community clean and reduces foaming. The biological stage is typically an MBR membrane bioreactor system for soft drink effluent at HRT 18–30 hr, MLSS 3,000–5,000 mg/L, and F/M 0.15–0.35 kg BOD/kg MLVSS·d, achieving >95% COD removal. Polishing to <10 mg/L TSS is followed by a ClO₂ generator for effluent disinfection sized for 2–5 mg/L dose and 30-minute contact, which delivers residual-free microbial control suitable for both discharge and reuse.
SBR vs MBR: Which Biological Stage Fits Your Plant
The 2015 lab study (ResearchGate, 2015-11) validated aerobic SBR with ozone polishing on a high-COD soft drink influent. SBR remains a credible option — but in 2026 the brownfield default is MBR, and the greenfield default in most EPC specs is also MBR. The decision comes down to footprint, effluent quality, and reuse intent.
| Criterion | Aerobic SBR | MBR (flat-sheet DF series) |
|---|---|---|
| Footprint | Baseline (100%) | ~40% of SBR footprint |
| Effluent COD (typical) | 80–120 mg/L | <50 mg/L (often <30 mg/L) |
| Effluent TSS | 20–40 mg/L | <5 mg/L (membrane-separated) |
| Operator skill | Moderate (batch sequencing, decant) | Lower (continuous flow, automated backwash) |
| Best-fit plant profile | Low flow, batch-friendly staff, no reuse target | Reuse target, brownfield retrofit, tight footprint |
| 2015 study reference | Validated (ozone-coupled) | Not the tested configuration; now the 2026 default |
For brownfield retrofits where an existing equalization basin can be repurposed as a membrane tank, the DF-series flat-sheet MBR membrane module drops in without major civil work. When the plant's goal is reuse in cooling towers or CIP pre-rinse, MBR is the lower-risk path because suspended solids are already membrane-separated before the polishing RO train. SBR is still a defensible choice for plants below 50 m³/day where the operator team prefers batch control and there is no reuse obligation.
2026 CAPEX and OPEX Benchmarks
The 2026 budget numbers below are derived from HydropureWater field data and are intended as procurement-level estimates, not vendor quotes. Treat them as ±20% until a site-specific P&ID is issued.
| Capacity | Turnkey CAPEX (USD) | Scope | All-in OPEX (USD/m³) |
|---|---|---|---|
| 50 m³/day | $95K–$220K | EQ + DAF + SBR + ClO₂, no reuse | $0.70–$1.40 |
| 100 m³/day | $180K–$420K | EQ + DAF + MBR + ClO₂, with reuse polish | $0.55–$1.20 |
| 500 m³/day | $1.1M–$2.0M | EQ + DAF + MBR + RO + ClO₂, full reuse loop | $0.45–$0.95 |
| 1,000 m³/day | $2.2M–$3.8M | Multi-line EQ + MBR + RO + sludge dewatering | $0.40–$0.80 |
OPEX at 100 m³/day breaks down as: energy 35–45% (blowers and recirculation pumps dominate), chemical dosing 15–20% (coagulant for DAF, antifoam, CIP chemicals for membranes), labor 20–25%, and membrane replacement plus sludge handling 10–15%. The two variables that move OPEX the most in an MBR plant are membrane replacement cycles (typically 5–7 years for flat-sheet DF modules) and CIP chemical cost — both covered in the 2026 MBR OPEX breakdown reference. An all-in OPEX of $0.55–$1.20 per m³ treated is competitive with municipal tariffs in most regions and typically beats potable-water purchase cost for the reuse streams it replaces.
Discharge vs Reuse: 2026 Compliance Targets
The compliance matrix below maps the four most common end-of-pipe scenarios to the regulatory standards a 2026 plant is likely to face. Choose the standard that matches both the discharge point and the local regulator.
| End use | COD | BOD₅ | TSS | Microbial | Applicable standard |
|---|---|---|---|---|---|
| Direct discharge (EU) | <50 mg/L (125 mg/L permitted, tightened 2026) | <10 mg/L (25 mg/L permitted) | <10 mg/L (35 mg/L permitted) | — | EU Directive 91/271/EEC |
| Direct discharge (China) | <50 mg/L | <10 mg/L | <10 mg/L | Fecal coliform <10³ CFU/L | GB 18918-2002 Grade 1A |
| Direct discharge (US) | Per categorical limits | Per categorical limits | Per categorical limits | — | EPA 40 CFR 133 + state NPDES |
| Cooling-tower / landscape reuse | <30 mg/L | <10 mg/L | <5 mg/L | Fecal coliform <200 CFU/100 mL | WHO Guidelines for Safe Reuse (2017, still in force 2026) |
| Boiler feed / CIP pre-rinse | <10 mg/L | <5 mg/L | <1 mg/L | <1 CFU/100 mL | TDS <50 mg/L via industrial RO polish for boiler-feed or CIP reuse |
For cooling-tower makeup or landscape irrigation, MBR + ClO₂ is sufficient. For boiler feed or CIP pre-rinse, an industrial RO polish for boiler-feed or CIP reuse drops TDS below 50 mg/L and pushes the microbial count to detectably zero. The RO train typically adds 15–25% to turnkey CAPEX but is paid back in 2–4 years through avoided potable-water purchases at most 2026 industrial tariffs. For a broader view of how MBR design intersects with food and beverage compliance, see the MBR design for food and beverage plants engineering spec, and for current US-side discharge requirements the 2026 food and beverage compliance reference consolidates the categorical limits. Engineers sizing a new build with reuse intent should also review 2026 resource recovery trends for the technologies reshaping RO concentrate handling and biogas capture on beverage sites.
Frequently Asked Questions
What is the typical COD range for soft drink manufacturing wastewater?
Influent COD typically falls between 3,000 and 7,000 mg/L, with peak design values up to 10,000 mg/L during syrup spills or CIP upsets. The 2015 ozone + SBR study (ResearchGate, 2015-11) flagged high COD as the defining characteristic of the stream.
Which biological treatment works best for soft drink wastewater — SBR or MBR?
Both work; the 2015 study validated aerobic SBR with ozone polishing, but the 2026 default for new builds is MBR because it delivers <50 mg/L effluent COD, occupies roughly 40% of the SBR footprint, and produces reuse-ready water without a separate clarifier.
How much does a 100 m³/day soft drink wastewater treatment plant cost in 2026?
Turnkey CAPEX is in the $180,000–$420,000 range, with an all-in OPEX of $0.55–$1.20 per m³ treated. The largest OPEX variables are energy (35–45% of total) and membrane replacement at the 5–7 year mark.
Can treated soft drink wastewater be reused for cooling towers or CIP pre-rinse?
Yes. MBR + ClO₂ polish meets the typical cooling-tower reuse target of COD <30 mg/L, TSS <5 mg/L, and fecal coliform <200 CFU/100 mL. Boiler feed and CIP pre-rinse reuse requires an additional RO pass to drop TDS below 50 mg/L.
What is the minimum pH stability required for the biological stage?
Hold pH between 6.5 and 8.0 in the aeration tank to keep the F/M ratio stable at 0.15–0.35 kg BOD/kg MLVSS·d. CIP events swing raw influent from pH 4 (acid) to pH 11 (caustic), which is why the equalization basin must include active pH correction, not just flow buffering.