Why Battery Gigafactory Wastewater Cannot Be Treated Like a General Industrial Stream
A 10 GWh lithium-ion cell plant discharging 4,000 m³/day of mixed NMP/LiPF6/LiOH stream represents a wastewater matrix that breaks every assumption built into a conventional chemical or electroplating treatment train. The combination of a hydrolysing fluorine donor (LiPF6), a high-COD polar aprotic solvent (NMP, 8,000–20,000 mg/L), a strong base (LiOH), a PFAS load from fluorinated electrolyte salts (LiTFSI, LiFSI, LiODFB), and a flammability hazard from NMP vapours in enclosed coating dryers means the streams must be segregated at source before they ever reach a common header. Generic DAF + biological treatment packages — the default for food, textile, or refinery wastewater — fail on three counts: they cannot remove fluoride below 10 mg/L, they are destroyed by the pH swings between electrolyte lines (pH 2–4) and coating lines (pH 6–9), and they do not address PFAS, which is now under the proposed EU REACH universal restriction scheduled for 2026 alongside the 2025 EPA NPDES effluent guidelines revision and simultaneous tightening of China GB 30485/30486 and Vietnam QCVN 40. Designing an energy storage battery wastewater treatment solution therefore requires four segregated sub-trains feeding a shared polishing loop, not one homogenised equalisation tank. LiPF6 hydrolysis on water contact produces HF, LiF, phosphoric acid, and PFAS within seconds — a dry-room condensate line that accidentally cross-connects with a coating rinse header will generate HF gas at concentrations that destroy carbon-steel piping, kill biological activity downstream, and void the EH&S sign-off in a single shift.
Stream-by-Stream Characterisation: What Comes Out of Each Battery Plant Operation
Stream segregation is the single most consequential design decision in a battery plant WWTP. Each operation generates a distinct pollutant fingerprint, and pre-defining target concentrations for each sub-stream is what allows the unit processes that follow to be sized correctly. The four primary streams and their typical 2026 influent envelopes are summarised below.
| Source operation | Key pollutants | COD (mg/L) | F⁻ (mg/L) | Li⁺ (mg/L) | pH | Target sub-train |
|---|---|---|---|---|---|---|
| Cathode coating rinse (NMP stripping bottoms) | NMP, PVDF binder fines, carbon black | 8,000–20,000 | <10 | <5 | 6–9 | NMP recovery + biological |
| Electrolyte filling exhaust scrubber | LiPF6, HF, LiTFSI/LiFSI/LiODFB (PFAS) | 500–2,000 | 200–1,000 | 10–50 | 2–4 | Ca²⁺ precipitation + GAC |
| Formation cycling bleed water | LiPF6, ethylene/propylene carbonate, LiODFB | 2,000–5,000 | 100–300 | 50–150 | 3–5 | Dedicated F-recovery loop |
| Module pack rinse & assembly | Glycol, VOCs, trace oils | 500–2,000 | <5 | <2 | 6–8 | DAF + biological |
NMP stripping column bottoms remain biotreatable provided the upstream vacuum or steam stripper recovers condensed NMP at >99% purity and the residual solvent load stays below roughly 3,000 mg/L going into the bioreactor (HydropureWater field data, 2026). Electrolyte line scrubber effluent is the most aggressive stream — high F⁻, low pH, and the only stream guaranteed to carry measurable PFAS — and it must be neutralised and precipitated before it touches any biological stage. Formation bleed water sits between the two and is often bled into the electrolyte sub-train to consolidate F-recovery. Module rinse is the lightest stream and the natural candidate for shared DAF pretreatment.
Core Treatment Train: From Coagulation/DAF to RO/Evaporator ZLD
The defensible 2026 treatment train for a mixed NMP/LiPF6/LiOH plant runs in four sequential stages, each solving one problem class. The DAF pretreatment skid for module pack and electrode rinse water is sized on peak 1.5× design flow and removes 90–95% of TSS, oil/grease, and PVDF binder fines that would otherwise foul downstream membranes within days. Coagulant dose typically runs 30–80 mg/L PAC plus 2–5 mg/L anionic polymer, with a hydraulic residence time of 20–30 minutes and a surface loading of 5–10 m³/m²·h.
Fluoride precipitation is the second stage and the most chemistry-sensitive. Calcium chloride or lime is dosed at pH 7.5–8.5 through an automatic CaCl2/NaOH dosing system to drive F⁻ below 10 mg/L. CaCl2 is preferred over lime for battery plants because it produces 1.5–2 kg of dry CaF2 sludge per m³ treated versus 5–6 kg/m³ for lime (HydropureWater field data, 2026) — a meaningful difference in hazardous-waste disposal cost. The reaction is fast (15–20 min HRT) but requires a 60-minute maturation stage for full CaF2 crystallisation before the clarifier.
MBR is the third stage, selected for its ability to handle the residual COD from stripped NMP and carbonate solvents while producing reusable permeate. A submerged PVDF hollow-fibre module at 0.1 µm pore size, operated at 10–15 L/m²·h flux with mixed liquor suspended solids of 8,000–12,000 mg/L, cuts COD from 3,000–6,000 mg/L to below 50 mg/L — a removal efficiency above 98% that conventional CAS plus secondary clarifier cannot match in a 60% smaller footprint. The MBR for organics and reuse water also acts as a barrier to biomass washout when influent F⁻ briefly spikes, which is a real risk during electrolyte-line upset events.
Two-pass RO and MVR evaporation close the loop. The RO for polishing and 95% water reuse runs at 70–80% recovery per pass, with inter-stage booster pumps and CIP cycles every 4–6 weeks. RO reject — 10–15% of feed flow — feeds a mechanical vapour recompression evaporator that produces distillate at <50 mg/L TDS and concentrates the F-rich brine to over 200,000 mg/L TDS for either licensed disposal or downstream lithium recovery. End-to-end water reuse reaches 95%+, and the F-rich brine becomes a feedstock for Li₂CO₃ precipitation rather than a waste. For the engineering precedent behind the HF/F⁻ removal chemistry, the HF/F⁻ removal precedent from solar PV manufacturing applies almost unchanged.
| Stage | Unit process | Influent target | Effluent target | Removal | HRT / recovery |
|---|---|---|---|---|---|
| 1 — Pretreatment | DAF + lamella | 200–500 mg/L TSS, oil, binder | <30 mg/L TSS | 90–95% | 20–30 min |
| 2 — F⁻ removal | CaCl2 precipitation | 50–500 mg/L F⁻ | <10 mg/L F⁻ | 90–95% | 60 min incl. maturation |
| 3 — Organics | Submerged MBR (PVDF 0.1 µm) | 3,000–6,000 mg/L COD | <50 mg/L COD | >98% | 6–8 h |
| 4 — Polishing / reuse | 2-pass RO + MVR | <50 mg/L TDS permeate | <10 mg/L F⁻, >95% reuse | 95%+ overall | 70–80% RO recovery |
Unit-Process Comparison: DAF vs Lamella, MBR vs SBR, RO vs Evaporator
Procurement and finance will challenge every unit-process selection, so the comparison below maps the operating envelope of each candidate against the actual battery-plant load. The point is not to crown a universal winner but to make the selection rule explicit: pick the unit that matches the dominant pollutant on each sub-stream.
| Function | Option A | Option B | Selection rule | Recommended for battery plant |
|---|---|---|---|---|
| Pretreatment (oil/binder) | DAF (4–300 m³/h) | Lamella clarifier | DAF wins when oil/grease >50 mg/L or binder fines present; lamella wins on capex for low-FOG streams | DAF for module rinse; lamella clarifier for formation cycling bleed |
| Biological (organics) | Submerged MBR (PVDF 0.1 µm) | SBR / A-O | MBR for footprint, reuse water, and F⁻ tolerance up to ~30 mg/L; SBR/A-O only when F⁻ <20 mg/L and sewer discharge is acceptable | MBR for organics and reuse water on all four sub-trains |
| Polishing / reuse | Two-pass RO | MVR / falling-film evaporator | RO for general water reuse; MVR for ZLD when brine disposal is restricted or Li recovery is being added | RO + MVR for 95% reuse, brine to Li recovery |
| Sludge dewatering | Plate & frame filter press | Centrifuge | Filter press for CaF2 sludge to 60–65% DS; centrifuge for biological surplus | Filter press for CaF2; centrifuge for waste activated sludge |
Three selection rules follow from the table. First, do not use a single homogenised equalisation tank — the pH and F⁻ spread between electrolyte and coating lines will burn reagent and create CaF2 scaling inside the biological stage. Second, do not specify SBR or A/O for the electrolyte or formation sub-trains: even at F⁻ of 15–20 mg/L, biological activity is suppressed by 30–50%, and the resulting non-compliant COD bleed-through forces the RO membranes to compensate. Third, MVR is not a luxury — it is the only unit process that converts a hazardous F-rich brine into a Li-recovery feedstock rather than a Class-I waste shipment.
2026 CAPEX/OPEX Ranges and 5-Year Payback for a 10 GWh Cell Plant
Translating the engineering scope into numbers a CFO will sign requires defensible ranges, not point estimates. The CAPEX envelope for a 3,000–4,500 m³/day train (DAF + Ca²⁺ precipitation + MBR + two-pass RO + MVR evaporator) sits at USD 4–8 million in 2026, with ZLD configurations pushing toward the upper bound. Major cost drivers in descending order: stainless-steel and PP piping (20–25%), membrane modules (15–20%), evaporator body and compressor (15–20%), civil works and tanks (15–20%), and I&C plus installation (15–20%).
OPEX runs USD 0.6–1.2 million per year for the same plant. The cost stack is dominated by chemicals (CaCl2, NaOH, antiscalant, CIP reagents) at 25–30% and energy (RO high-pressure pumps, MVR compressor, blowers) at 35–40%. Sludge disposal to a licensed hazardous-waste hauler accounts for 15–20%, membrane replacement (RO and MBR) for 8–10%, and labour plus consumables the remainder. The RO cost model referenced in the battery train economics provides a line-by-line breakdown that scales linearly with feed flow and recovery rate.
| Cost line | 2026 range (USD) | Share of OPEX | Key sensitivity |
|---|---|---|---|
| CAPEX (3,000–4,500 m³/day, ZLD) | 4–8 M | — | +30% if full SS316 piping |
| Chemicals (CaCl2, NaOH, antiscalant) | 0.15–0.36 M/yr | 25–30% | CaCl2 price, F⁻ load |
| Energy (RO + MVR + blowers) | 0.21–0.48 M/yr | 35–40% | Electricity tariff |
| Sludge disposal (CaF2 + WAS) | 0.09–0.24 M/yr | 15–20% | Disposal route, kiln vs landfill |
| Membrane replacement | 0.05–0.12 M/yr | 8–10% | Feed quality, CIP frequency |
| Annual water-reuse saving | 0.3–0.5 M/yr | — | Local water tariff |
| Simple payback | 4–6 years | — | Includes NMP recovery credit |
Payback is 4–6 years for a typical Asian or U.S. Southwest site where municipal water costs USD 2–4/m³ and NMP recovery credit is captured (HydropureWater field data, 2026). In water-stressed regions the water-reuse saving alone covers 40–60% of OPEX, and avoided NMP purchase plus reduced PFAS permit exposure closes the gap. The financial case is harder to defend only when local water is below USD 0.5/m³ and electricity above USD 0.12/kWh — in which case a partial-reuse train without MVR should be screened first.
2026 Compliance Checklist: EPA, EU, China, and Vietnam Discharge Limits
Hand the table below to your EH&S team. It is the regulatory floor for a battery plant WWTP discharging in 2026 across the four jurisdictions where most gigafactories are being built.
| Jurisdiction | Standard | F⁻ limit | COD limit | PFAS position | Notes |
|---|---|---|---|---|---|
| USA | EPA NPDES 2025 revision | 32 mg/L max daily | 50 mg/L 30-day avg (BOD 30) | Reportable under CAA 8:1 category | State permits may be stricter |
| EU | IED 2024/1785 BAT-AELs | 10 mg/L | Site-specific | PFAS total 0.1 µg/L; REACH restriction proposed 2026 | Universal PFAS restriction in force from 2026 |
| China | GB 30485-2020 / GB 30486 | 10 mg/L | 30 mg/L (reuse), 50 mg/L (discharge) | Draft GB/T PFAS standard | Process-water reuse is mandatory above 70% |
| Vietnam | QCVN 40:2011/BTNMT (amended 2025) | 10 mg/L | 50 mg/L | PFAS aligned with EU trajectory |
Three flags for 2026. First, the EU PFAS universal restriction proposal — published 2023 and scheduled to apply from 2026 — covers LiTFSI, LiFSI, LiODFB and most fluorinated electrolyte salts at any concentration, so even recycled process water must meet 0.1 µg/L PFAS-total before reuse. Second, the EPA 2025 NPDES revision reduced the F⁻ limit from 48 mg/L to 32 mg/L max daily and added a PFAS reporting category under the Clean Air Act 8:1 industrial grouping. Third, both China and Vietnam now require 70%+ process-water reuse for new plants — ZLD or near-ZLD is no longer optional for gigawatt-scale facilities.
Sludge and Brine Handling: Where the Fluoride, Lithium, and PFAS End Up
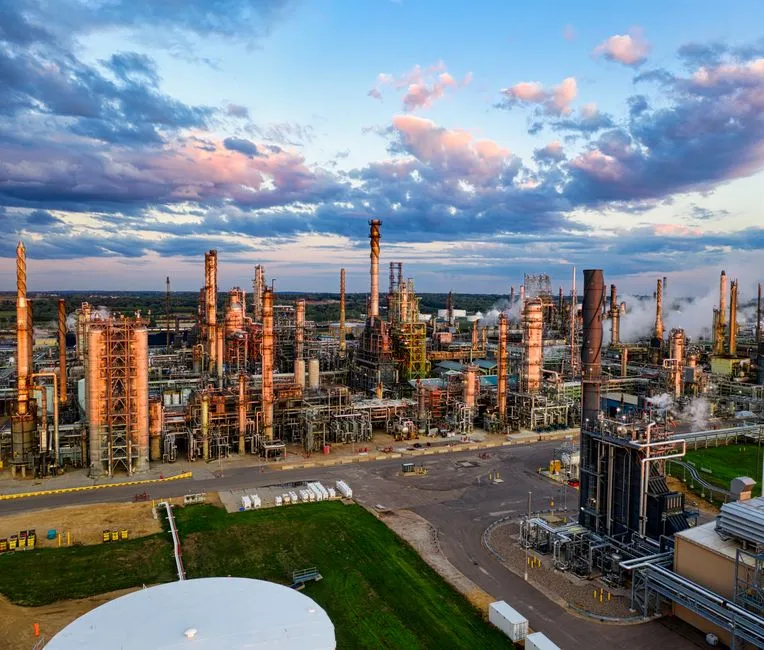
The liquid discharge is only half the environmental footprint. CaF2 sludge from the precipitation stage runs 3–6 kg dry weight per m³ of treated electrolyte and formation bleed, with residual Li⁺ of 0.5–1.5% and measurable PFAS if the upstream segregation failed. Routing options are cement kiln co-processing (preferred when PFAS is below 50 mg/kg dry) or hazardous-waste landfill as a fallback. A filter press for CaF2 sludge dewatering typically achieves 60–65% dry solids, which is the threshold for direct kiln feed without auxiliary drying.
RO reject brine at 10–15% of feed flow carries F⁻ of 1,000–3,000 mg/L and Li⁺ of 500–1,500 mg/L. Mechanical vapour recompression concentrates this brine to over 200,000 mg/L TDS, after which Li⁺ is precipitated as Li₂CO₃ at 80–90% recovery using Na₂CO₃ dosing at pH 11–12. PFAS-bearing GAC from the electrolyte-line polishing step is generated at 50–200 kg per 1,000 m³ treated and must be incinerated above 1,100 °C with a wet scrubber to destroy the fluorinated organics. Anything below that temperature risks PFAS re-emission and a permit violation.
Frequently Asked Questions
What removal efficiency should we expect for fluoride in a battery plant WWTP?
Two-stage CaCl2 precipitation at pH 7.5–8.5 followed by MBR polishing reliably delivers 90–95% F⁻ removal, bringing 50–500 mg/L influent down to under 10 mg/L. With a polishing ion-exchange stage the residual F⁻ can be driven below 2 mg/L for reuse in formation cycling (HydropureWater field data, 2026).
Can NMP be recovered economically from cathode coating wastewater?
Yes. Vacuum or steam stripping of the NMP-rich condensate upstream of the biological stage recovers 99%+ of the NMP at 95–99% purity, which is directly reusable in the coating step. The recovered NMP offsets 30–50% of the OPEX of the entire WWTP at 2026 NMP prices.
What CAPEX should a 10 GWh cell plant budget for a full ZLD train in 2026?
USD 4–8 million for a 3,000–4,500 m³/day train including DAF, Ca²⁺ precipitation, MBR, two-pass RO, and MVR evaporator. ZLD configurations with brine solidification sit at the upper end of the range (HydropureWater field data, 2026).
How is PFAS from fluorinated electrolyte salts treated?
GAC adsorption after the Ca²⁺ precipitation stage captures the LiTFSI/LiFSI/LiODFB fraction, with spent carbon incinerated above 1,100 °C. The proposed EU REACH universal PFAS restriction from 2026 sets the discharge target at 0.1 µg/L PFAS-total, which is achievable only with GAC plus a final RO polish.
Why segregate electrolyte scrubber water from cathode coating rinse?
Mixing them would drive pH toward 3–4 across the entire equalisation tank, generate uncontrolled HF from LiPF6 hydrolysis, and force the downstream biology to operate below its inhibition threshold. Segregation keeps the coating train near neutral pH and routes the F⁻ load to a dedicated precipitation loop.
Related Equipment
- DAF pretreatment skid for module pack and electrode rinse water — specifications, capacity range, and technical data
- MBR for organics and reuse water — specifications, capacity range, and technical data
- RO for polishing and 95% water reuse — specifications, capacity range, and technical data