Why Wood Processing Wastewater Is Expensive to Treat
Wood processing wastewater treatment cost in 2026 typically runs $150,000–$1,400,000 in CAPEX and $0.08–$0.35 per m³ in OPEX for a 500–10,000 m³/day facility, driven by influent COD (1,500–8,000 mg/L), resin acid and tannin loads, and whether effluent targets reuse. A standard train — DAF pre-treatment → SBR or MBBR → Fenton or ozone polishing — handles 85–95% COD removal and meets China GB 3544-2008 and EU BAT-AEL discharge limits.
Wood-plant effluent sits in a difficult corner of the industrial wastewater spectrum. Typical influent values run COD 1,500–8,000 mg/L, BOD₅ 800–4,000 mg/L, suspended solids 500–3,500 mg/L, and pH that swings from 4 to 9 as hot-press condensates mix with cold debarking water (per Toczyłowska-Mamińska 2020 wood-based panel data). The BOD₅/COD ratio lands near 0.45 — biodegradable, but only after you clear the recalcitrant fraction.
Three wood-specific toxicants drive most of the cost premium:
- Resin acids (abietic, dehydroabietic, pimaric) leached from softwood pitch inhibit heterotrophic biomass above 20 mg/L, forcing longer SRT and bigger aeration tanks.
- Tannins and lignin breakdown products produce 1,500–4,000 Pt-Co colour units, which biological treatment alone cannot strip — that's why a polishing stage is non-negotiable for any reuse loop.
- Formaldehyde (10–100 mg/L) from UF/MDF resin blending, plus phenol from phenol-formaldehyde (PF) lines, adds a 15–25% CAPEX premium versus a comparable plywood plant.
Seasonal load swings bite just as hard. Summer condensates can double the BOD load on the equalization basin within an hour, and bark-debarking water spikes SS to 5,000+ mg/L during log breakdown. Without 8–24 h HRT equalization, downstream biology sees a feast-or-famine profile and never reaches steady nitrification. The 2026 cost range above is a direct function of these influent drivers — not a generic industrial number — and the chemical cost optimization guide covers how coagulant and polymer selection compounds the effect.
Standard Treatment Train for Wood Industry Effluent
A defensible 2026 wood-plant train runs six stages: screening, equalization, DAF, biological, polishing, and sludge dewatering. Each stage carries published hydraulic and removal parameters you can lift into a PFD.
| Stage | Unit process | Key parameter | Typical range | Primary removal |
|---|---|---|---|---|
| 1 | Rotary bar screen | Aperture | 3–6 mm | Bark, fibres, plastic debris |
| 2 | Equalization basin | HRT | 8–24 h | Diurnal COD/flow swing |
| 3 | DAF | Surface loading | 5–25 m/h | SS, fibres, entrained resin (60–90%) |
| 3 | DAF | Air-to-solid ratio | 0.005–0.015 | — |
| 4 | SBR or MBBR | HRT | 12–36 h | COD/BOD (85–95%) |
| 4 | SBR or MBBR | MLSS | 3,000–5,000 mg/L | — |
| 5 | Fenton or O₃/UV AOP | Energy demand | up to 11 kWh/kg COD | Resin acids, colour, COD polishing |
| 6 | Plate-and-frame press | Cake dryness | 22–28% DS | Sludge volume reduction |
Stage 1 uses a continuous-duty rotary bar screen with a stainless rake for bark and fibre capture. Stage 3 (DAF) is the workhorse — a properly sized DAF system for wood-industry pre-treatment pulls 60–90% of SS and most of the entrained pitch before biology sees it. Stage 4 typically runs SBR for variable loads or MBBR (carrier-media biofilm) for cold sites; both deliver 85–95% COD/BOD removal when MLSS holds 3,000–5,000 mg/L, but kinetics slow 40–60% below 10 °C. Stage 5 (Fenton with Fe²⁺/H₂O₂ at pH 3–3.5, or ozone/UV AOP) is what strips residual resin acids and colour; advanced oxidation carries an energy demand that can hit 11 kWh/kg COD per Toczyłowska-Mamińska 2020. Stage 6 finishes with a plate-and-frame filter press for wood-sludge dewatering reaching 22–28% dry solids — small sawmills can substitute a screw press.
2026 CAPEX Breakdown by Plant Size and Sub-Sector
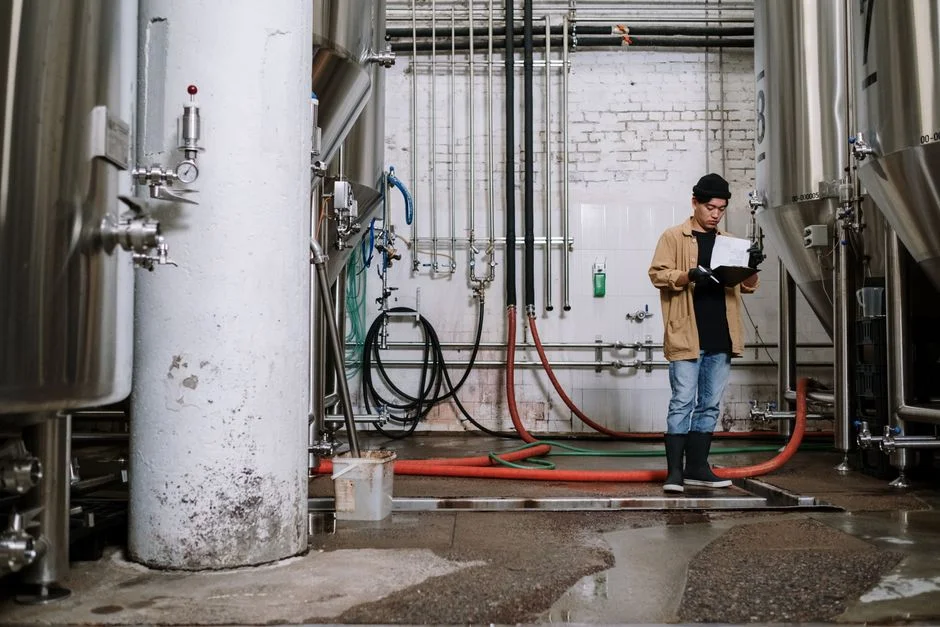
Sub-sector matters more than flow rate. A 2,000 m³/day plywood plant and a 2,000 m³/day MDF plant can differ by 20–30% on total CAPEX because UF/MDF lines carry a formaldehyde-destruction premium.
| Plant profile | Flow (m³/day) | CAPEX range (USD) | Scope included |
|---|---|---|---|
| Small sawmill | <500 | $150,000–$350,000 | Equalization + DAF + packaged SBR + sludge press |
| Mid plywood / veneer | 500–2,000 | $350,000–$750,000 | Adds MBBR with carrier media, chemical dosing, Fenton polishing |
| Large MDF / OSB / particleboard | 2,000–10,000 | $750,000–$1,400,000 | Full biological + AOP + reuse loop with UF/RO; +15–25% for formaldehyde destruction |
| Upgrade-only (existing infrastructure retained) | Any | $65,000–$200,000 | Per Molewater 2026 benchmark — specific unit swaps, no new civil |
Budget roughly 20% of CAPEX for civil works and installation, 10% for automation and PLC, and 5–8% contingency. Plants targeting water reuse rather than simple discharge should plan for an additional 30–60% CAPEX premium on the polishing train (see comparison section below). San Francisco-area CAPEX benchmarks for industrial wastewater in 2026 confirm the flow-rate scaling pattern, with retrofit projects clustering in the $65K–$200K band when basins and blowers are reused.
2026 OPEX: What You Actually Pay Per Cubic Metre
Total OPEX for wood-plant wastewater in 2026 lands at $0.08–$0.35 per m³ treated, with large facilities at the low end and small sawmills at the high end. The four OPEX line items behave predictably:
- Energy — 45–60% of OPEX. Aeration dominates (blower kWh per kg BOD removed), followed by transfer pumps and AOP power. The SBR operating cost 2026 breakdown documents this 45–60% energy share for sequencing-batch systems and the blowers are usually the first target for VFD retrofits.
- Chemicals — 10–20% of OPEX. Coagulant (PAC or ferric chloride), polymer, Fenton reagents (H₂O₂, FeSO₄), and pH adjusters (NaOH, H₂SO₄). A well-tuned lamella clarifier with sludge recirculation cuts coagulant dose up to 30% by returning active floc, and pairing it with a precise automatic chemical dosing system keeps polymer consumption on target. Full chemical optimization tactics are in the wastewater treatment chemical cost optimization guide.
- Sludge handling — 15–25% of OPEX. Dewatering energy, polymer conditioning, transport, and landfill or incinerator tipping fees.
- Labour and maintenance — 10–15% of OPEX. Operator hours, membrane replacement, and consumables.
A 1,000 m³/day sawmill running DAF + SBR with no AOP will sit near $0.12/m³ OPEX; a 5,000 m³/day MDF plant running biological + Fenton + UF lands closer to $0.18/m³ because of the AOP energy and membrane replacement.
Comparing Treatment Options: Discharge vs Water Reuse
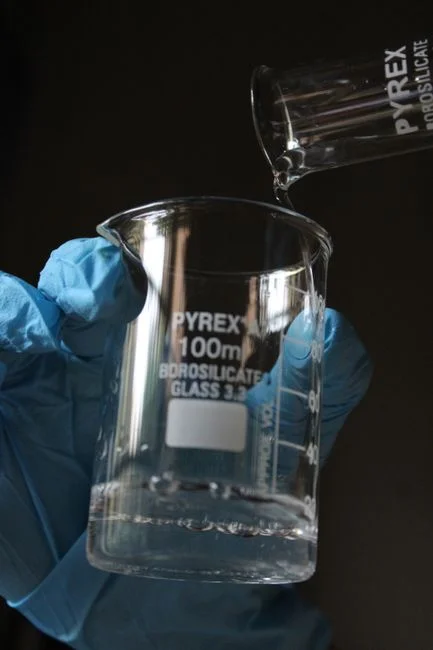
The discharge-versus-reuse decision sets the equipment list. Most sawmills and plywood plants only need biological treatment to meet discharge consent; MDF/OSB plants and water-stressed sites usually need a reuse loop to control intake costs.
| Option | Train | Effluent COD target | Water recovery | OPEX premium vs discharge-only | Compliance |
|---|---|---|---|---|---|
| Discharge only (biological) | DAF + SBR/MBBR | ≤100 mg/L | 0% | Baseline ($0.08–$0.18/m³) | China GB 3544-2008 wood-based panel; EU BAT-AEL ranges |
| Reuse for process / irrigation | Add Fenton or O₃ + UF | ≤50 mg/L | 60–80% | +$0.05–$0.10/m³ | Internal reuse spec; meets most local discharge limits |
| Zero-liquid-discharge (ZLD) | Add RO + evaporator/crystallizer | ≤10 mg/L permeate | ≥95% | +$0.10–$0.15/m³ | Eliminates discharge fees in water-stressed regions |
An integrated MBR system for wood wastewater is a useful half-step: it tightens effluent quality (COD typically ≤50 mg/L, SS near zero) without the full AOP cost, and the MBR vs conventional activated sludge comparison is documented. For a true reuse loop, an RO system for water-reuse loops can push recovery to 95% — see the ultrafiltration OPEX breakdown 2026 for the membrane-side economics. Each reuse step typically adds $0.05–$0.15/m³ OPEX but cuts incoming water purchase by 50–80%, so payback in water-stressed regions often falls under 36 months.
How to Choose the Right System for Your Plant
Five procurement decisions lock in 80% of lifecycle cost. Run them in this order.
- Define the endpoint first. Discharge-only versus closed-loop reuse drives 70% of the equipment list and the CAPEX band. Pick this before talking to vendors.
- Match biology to climate. SBR handles variable loads from batch pressing and is more forgiving of operator skill gaps. MBBR is the right pick for sites that run below 10 °C in winter or where operator turnover is high.
- Verify toxicity with a bench test. Run a ≥2-week respirometry trial on your actual resin-acid and formaldehyde concentrations before signing CAPEX papers. If inhibition exceeds 30%, plan for a larger tank or a pre-acclimation stage.
- Specify skid-mounted, factory-tested skids. Pre-wired PLC panels and factory-tested packages cut on-site installation from 6–10 weeks to 2–3 weeks, which is the difference between a planned shutdown and a forced outage.
- Tie vendor guarantees to OPEX, not just CAPEX. Negotiate kWh/m³ and polymer kg/m³ performance guarantees with liquidated damages. CAPEX is a one-line write-off; OPEX runs for 20 years.
The cost-allocation logic above also holds for adjacent sectors — the 2026 CAPEX/OPEX pattern for automotive stamping wastewater tracks the same flow-rate and reuse-premium structure.
Frequently Asked Questions
How much does wood processing wastewater treatment cost in 2026? CAPEX runs $150,000–$1,400,000 for a 500–10,000 m³/day facility, with sawmills at the low end and MDF/OSB plants at the high end. OPEX lands at $0.08–$0.35 per m³ treated.
What influent COD and BOD are typical for wood industry effluent? COD 1,500–8,000 mg/L, BOD₅ 800–4,000 mg/L, SS 500–3,500 mg/L, with resin acids above 20 mg/L inhibiting biomass and 10–100 mg/L formaldehyde present in UF/MDF streams.
Can a sawmill reuse its treated wastewater? Yes. A DAF + SBR + UF/RO train typically recovers 60–80% of the flow for process water; a full RO loop reaches 95% recovery for closed-loop cooling or irrigation.
Which discharge standard applies to wood-based panel plants? China GB 3544-2008 sets COD ≤100 mg/L and SS ≤50 mg/L for the wood-based panel sector; EU BAT-AEL ranges govern plants shipping into or operating in the European Union, and US EPA Pulp & Paper effluent limits apply to U.S. sites.
What is the biggest OPEX driver? Energy, at 45–60% of total OPEX (mostly aeration and AOP), followed by sludge handling at 15–25%.