What an RO System Process Flow Diagram Actually Shows
An RO process flow diagram is a left-to-right schematic that traces feed water through four mandatory blocks — pre-treatment, high-pressure pumping, the membrane array, and post-treatment — plus the utility streams that keep the system running: chemical dosing, CIP recirculation, and high-flow flush. Three product streams must appear: feed in, permeate out, and concentrate (reject) out. In the NASA NTRS reference loop, the product/reject ratio is set at 50/50 at a production flow of 15 GPM, and a once-daily high-flow flush runs for 15 minutes with 90% of the flow diverted to the reject ports to scour solids off the membrane surface (NASA NTRS, 1986).
Two utility streams are usually missing from marketing infographics but always present in an engineering P&ID: the CIP loop that circulates cleaning solution across the membranes, and the antiscalant injection tap that sits between the cartridge filter and the high-pressure pump. The block sequence — raw water → multimedia/carbon filter → antiscalant dosing → cartridge filter → high-pressure pump → membrane vessels → permeate storage → post-treatment → concentrate disposal or energy-recovery loop — is identical for brackish (BWRO), seawater (SWRO), and two-pass ultrapure architectures; only the equipment inside each block changes.
Pre-Treatment Block: Protecting the Membrane
Pre-treatment is the block that determines whether the rest of the skid performs to spec. The FDA ITG lists the standard pre-treatment train as a sand bed, chlorinator with retention tank, anthracite filter, activated carbon filter, degasifier, microfilter, neutralizer, and deionizer, with pH adjustment and a prefilter placed immediately before the high-pressure pump (FDA ITG, 1980-10-21). The FDA states the goal plainly: feed water after prefiltration must keep dissolved solids and bacterial levels within the membrane's design limits to prevent fouling, scaling, or bacterial shedding into the permeate.
Chunke reinforces the same hierarchy: pre-treatment is the single biggest determinant of RO performance because the membrane skin is the most expensive consumable on the skid. Microbiological control is non-negotiable. Chunke cites a <10 CFU/100 mL limit for RO product water, and the FDA warns that stagnant downstream piping is the main source of bacteria and endotoxin — which means pre-treatment must be paired with a continuous-flow piping design, not a batch tank. On a real flow diagram, this block usually shows a multi-media pre-filter for turbidity and an antiscalant and pH dosing skid feeding the cartridge filter.
| Pre-Treatment Step | Stream Target | Engineering Reason |
|---|---|---|
| Multimedia / sand + anthracite | Suspended solids, turbidity | Prevents particulate fouling on the membrane skin |
| Activated carbon | Free chlorine, organics | Protects polyamide membranes from oxidation |
| Antiscalant dosing | Ca²⁺, Ba²⁺, SiO₂ scaling ions | Keeps concentrate below saturation index |
| pH adjustment | Feed pH 6.5–7.0 typical | Cellulose acetate membrane range 55–86 °F / 13–30 °C (FDA ITG) |
| Cartridge filter (5 µm) | Final guard before pump | Catches dosing precipitates and carbon fines |
High-Pressure Pump and Membrane Array
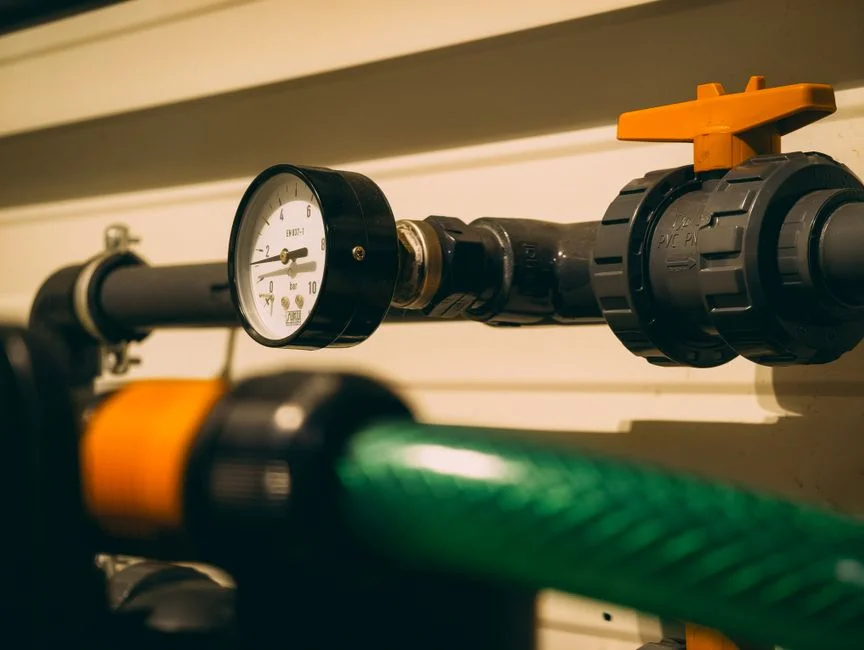
The pump-and-vessel block is where the diagram's pressure rating and energy consumption are defined. The FDA ITG describes the membrane modules as spiral-wound or hollow-fiber sheets wound around a permeate tube and housed in a pressure vessel, with an active skin around 0.25 µm on a ~100 µm support layer (FDA ITG, 1980-10-21). The FDA also states that a membrane module lasts two to three years on average and that concentration polarization — gradual build-up of rejected solute on the feed side — is the main operating problem, which is why a flush cycle is built into every real P&ID. NASA NTRS specifies a 15-minute, 90%-reject flush once per day for their reference loop (NASA NTRS, 1986).
These components require precise sizing to maintain system efficiency. On the pump side, Chunke notes that high-pressure pumps are sized to deliver steady flow to the RO elements and that pump efficiency is a major OPEX driver — energy can reach about 50% of a plant's annual cost, which is why the energy-recovery device location on the concentrate line belongs in the spec. Chunke also reports that more than 14,451 desalination plants worldwide depend on these pumps, so specifying a pump with proven field duty is more important than chasing the highest nameplate efficiency. The flow-diagram block typically points to an industrial RO system skid and replacement RO membrane elements and pressure vessels as the two line items to compare across vendors.
| Block Component | Operating Setpoint | Engineering Decision |
|---|---|---|
| Membrane element | 85–98% nominal salt rejection (FDA ITG) | Spiral-wound vs hollow-fiber — spiral is less prone to fouling (FDA ITG) |
| High-pressure pump | ~65 PSI / 77 °F optimum (Chunke) | Pump efficiency drives ~50% of annual OPEX (Chunke) |
| Vessel array | Configured for 50–75% recovery typical | More vessels = more permeate at the same flux |
| Energy-recovery device | Sized to concentrate flow, not feed | Placement on concentrate line, not permeate line |
| Daily flush | 15 min @ 90% reject (NASA NTRS) | Mitigates concentration polarization between cycles |
Permeate, Concentrate, and Post-Treatment
Two streams leave the membrane array: permeate to storage, concentrate to drain or to an energy-recovery device. The FDA ITG shows the product stream pumped to a storage tank and the concentrate drained; on a real engineering diagram, the concentrate line carries a flow-control valve and, on larger plants, an energy-recovery device feeding pressure back into the high-pressure pump suction (FDA ITG, 1980-10-21). The TDS arithmetic is the same on every diagram: 300 ppm feed with 95% rejection yields 15 ppm permeate; 90% rejection yields 30 ppm permeate — recovery and rejection are inversely linked on a single-pass skid.
Effective post-treatment ensures permeate quality meets specific application requirements. For pharmaceutical or semiconductor reuse, the FDA recommends two RO modules in series to cut monovalent ions and bacterial contaminants; the same ITG notes that adding a deionizer downstream can push permeate below 0.1 ppm TDS with resistivity around 1 megohm-cm. Chunke positions post-treatment — remineralization, UV, or polishing — as the block that turns permeate into a fit-for-purpose stream for boilers, cooling, food, or process water. On a real P&ID, this block is often an EDI polishing stack followed by a UV sterilizer for sanitization, and the storage tank usually carries a recirculation pump to keep flow continuous past the membrane per the FDA's no-stagnation rule.
| Stream | TDS / Quality | Flow Path on Diagram |
|---|---|---|
| Feed (in) | Up to 5,000 ppm TDS practical ceiling (Chunke) | Multimedia → carbon → dosing → cartridge → pump |
| Permeate (out) | 15–30 ppm TDS at 90–95% rejection (FDA ITG); <0.1 ppm with DI polish | Membrane array → storage → post-treatment → user |
| Concentrate (out) | 4–6× feed TDS at 75% recovery | Flow-control valve → drain or ERD → pump suction |
| CIP return | Cleaning solution at pH 1–12 cycle | Dedicated CIP tank + pump, isolated valves |
Single-Pass vs Two-Pass, BWRO vs SWRO: How the Diagram Changes
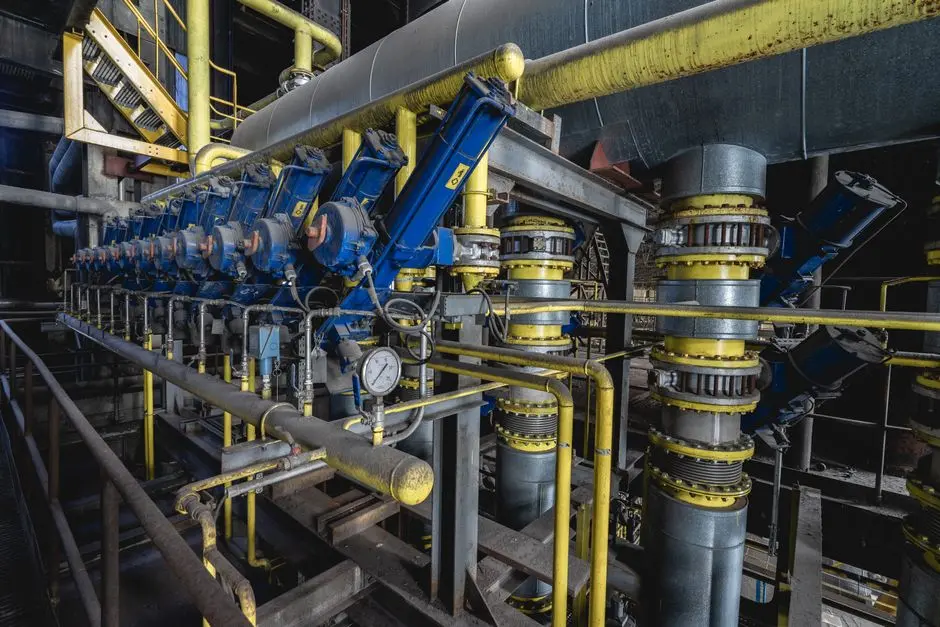
Single-pass RO — one membrane array — is the standard architecture for boiler feed, cooling-tower makeup, and general process water. Chunke cites 5,000 ppm feed TDS as a practical ceiling for industrial RO and >90% recovery on advanced systems, with optimum operation around 65 PSI and 77 °F. Two-pass RO routes the permeate of pass 1 into pass 2; the FDA ITG recommends it for parenteral solutions to reduce monovalent ions, and it is the standard architecture for semiconductor and pharmaceutical reuse where the permeate target is below 0.1 ppm TDS.
System requirements vary significantly based on feedwater salinity and purity targets. BWRO and SWRO differ only in pump pressure, membrane spec, and energy-recovery device placement on the concentrate line. The flow-diagram blocks are the same; only the equipment inside changes. SWRO plants run at 800–1,200 psi feed pressure with high-pressure ERDs (Pelton or isobaric) on the concentrate, while BWRO plants run at 150–300 psi with smaller turbochargers or no ERD. Per the FDA, the system should be designed for continuous flow with no dead legs or traps; intermittent operation reduces bacterial rejection efficiency because bacteria can "grow" through membranes during stagnation (FDA ITG, 1980-10-21).
| Architecture | Feed TDS Range | Permeate Target | Diagram Clue |
|---|---|---|---|
| Single-pass BWRO | ≤5,000 ppm (Chunke) | 15–30 ppm at 90–95% rejection (FDA ITG) | One membrane array, no second pass |
| Two-pass RO | ≤2,000 ppm typical | <0.1 ppm TDS, ~1 megohm-cm (FDA ITG) | Permeate of pass 1 feeds pass 2; DI polish common |
| SWRO | 35,000+ ppm seawater | <500 ppm permeate | High-pressure pump 800–1,200 psi, ERD on concentrate |
2026 Buyer Checklist: Reading a Supplier's RO Flow Diagram
Before signing a PO, every block on the supplier's flow diagram must have a written operating philosophy: recovery ratio, pass count, CIP frequency, and flush logic. Chunke notes that predictive maintenance tools can cut downtime by 20% — useful context for a service contract line item. Ask the vendor for the energy-recovery device location on the concentrate line, the antiscalant injection point before the cartridge filter, and the CIP isolation valves; these are the items most often missing from a one-page marketing diagram.
Cross-check any capacity claim against the FDA ITG TDS arithmetic: 300 ppm feed → 15–30 ppm permeate is the benchmark for 90–95% rejection on a single-pass skid. Confirm the membrane replacement interval (the FDA cites 2–3 years on average) and the cost of consumables; budget the antiscalant, CIP chemicals, and replacement valves and filter media on a per-cubic-meter basis rather than as a lump sum, so you can compare vendors line by line. If you want a textile or EV-wastewater reference architecture, see our textile-industry RO process guide and the RO vs ion exchange OPEX comparison.
Frequently Asked Questions
What blocks are mandatory on an industrial RO process flow diagram?
Four mandatory blocks: pre-treatment, high-pressure pump, membrane array, and post-treatment. Three product streams (feed, permeate, concentrate) plus utility streams (CIP, antiscalant injection, daily flush) must also appear. NASA NTRS specifies a 50/50 product
Frequently Asked Questions
What are the main blocks shown on an RO system process flow diagram?
A standard industrial RO process flow diagram (PFD) is divided into three primary functional blocks: Pre-treatment, the High-Pressure Pump (HPP) assembly, and the RO membrane skid. The pre-treatment block typically includes chemical dosing, multimedia filtration, and cartridge filtration to manage silt density index (SDI). The HPP block provides the necessary feed pressure to overcome the osmotic pressure of the solution, while the membrane skid block details the pressure vessels, permeate piping, concentrate headers, and CIP (Clean-in-Place) connections.
What is the typical recovery ratio for an industrial reverse osmosis system?
For industrial-grade systems, the typical recovery ratio ranges between 75% and 85% for brackish water applications. Higher recovery ratios exceeding 90% may be achieved through the use of concentrate staging or specialized high-rejection brackish water membranes, provided the feed water chemistry is treated to prevent the precipitation of sparingly soluble salts like calcium sulfate and silica.
How much does an industrial RO system cost to buy and operate in 2026?
Capital expenditure (CAPEX) for a skid-mounted industrial RO system in 2026 generally ranges from $2.00 to $5.00 per gallon per day (GPD) of capacity, depending on materials of construction and automation complexity. Operational expenditure (OPEX), including electricity, membrane replacement, and antiscalant chemicals, typically falls between $0.50 and $1.50 per 1,000 gallons of treated water, heavily influenced by local energy tariffs and feed water TDS levels.
When should I specify a two-pass RO system instead of a single-pass skid?
A two-pass RO system should be specified when the permeate conductivity requirements are stringent, such as in boiler feed water or high-purity process applications requiring less than 5 µS/cm conductivity. While a single-pass system can achieve 95% to 99.5% salt rejection, a two-pass configuration is necessary to consistently remove dissolved gases like CO2 and achieve the ionic purity levels mandated by ASME or semiconductor-grade standards.
What pre-treatment equipment must appear on the RO flow diagram to protect the membranes?
To ensure membrane longevity and prevent irreversible fouling, the PFD must include chemical injection skids for antiscalant and dechlorination agents, such as sodium bisulfite. Additionally, the diagram must specify multimedia filters or ultrafiltration (UF) modules to reduce SDI to below 3.0, and 5-micron absolute-rated cartridge filters located immediately upstream of the high-pressure pump to capture particulate matter that could cause mechanical damage to the membrane feed spacers.