Why Garland F&B Plants Can't Just Discharge to the Sewer
Food and beverage plants that discharge to the City of Garland sewer are legally defined as indirect dischargers and must hold an Industrial Pretreatment Program (IPP) permit before any flow enters the line. Garland's IPP draws its authority from Section 307 of the 1972 Federal Water Pollution Control Act (amended 1977), which directed the U.S. EPA to develop pretreatment standards preventing pollutants from interfering with, passing through, or otherwise being incompatible with publicly owned treatment works (garlandtx.gov). The city's local authority to inspect, permit, and enforce those standards comes through City Ordinance, and the program runs alongside TCEQ state oversight rather than replacing it.
The permit a Garland plant actually receives is site-specific: BOD, TSS, pH, and FOG caps are set against the receiving POTW's ability to handle the load, and any F&B facility generating high-strength effluent will see limits tighter than the federal floor. Surcharges stack on top of those limits once a discharge exceeds the cap. SAWS reference figures of $1.32 per mg/L of BOD above 250 mg/L and $3.05 per mg/L of TSS above 250 mg/L, multiplied by monthly discharge volume, are a transparent proxy for what an untreated food-processing stream will cost (Hixson). For a high-strength plant, the monthly bill becomes a six-figure line item long before any permit action is filed.
Enforcement escalates predictably: increased monitoring, a mandatory pretreatment installation order, and ultimately permit revocation, with documented cases of production shutdown when a discharge threatens POTW compliance (Crystal Clean; garlandtx.gov). A useful comparison point for indirect dischargers facing the same federal framework in other U.S. plants is detailed in this pretreatment compliance playbook for U.S. industrial facilities.
What Makes Food & Beverage Wastewater Different
Food processing effluents can run 10 to 100 times stronger than domestic wastewater in BOD and COD, and a dairy or brewery stream typically sits 10 to 20 times above the domestic baseline (Hixson; Crystal Clean). That is the root cause of the surcharge math above: the strength that comes off a process floor is not what a municipal plant was designed to receive. Three sources stack on top of each other: process water (washing, cooking, cooling) carries the bulk of the organics, CIP and sanitation cycles add caustic and acidic cleaners that swing pH across multiple units per shift, and cooling systems can contribute lubricants and other contaminants picked up from the equipment they serve (Crystal Clean).
Volume compounds the strength problem. Peak flows during washdowns and shift changes routinely exceed average design capacity, so a treatment train sized for steady-state influent will fail at the moments that matter most (Crystal Clean). FOG (fats, oils, and grease) and settleable solids are the Garland-specific red flag because they accumulate in sewer lines, foul lift stations, and damage the receiving POTW's biological process — the exact failure modes the federal pretreatment framework was written to prevent (Crystal Clean; Hixson).
The parameter ranges below summarize the operating envelope a Garland F&B plant has to design against. Values shown are qualitative bands drawn from the research; a buyer should request site-specific wastewater characterization from the lab before finalizing any equipment spec.
| Parameter | Typical F&B Range (qualitative) | Why It Matters for Garland IPP |
|---|---|---|
| BOD / COD | 10–100× domestic; dairy/brewery 10–20× domestic | Drives surcharge cost and biological stage sizing |
| FOG / TSS | High and variable with product mix | Triggers sewer-line accumulation and POTW upsets |
| pH | Swings acidic to alkaline across CIP cycles | Damages infrastructure and biology outside 5–9 band |
| Flow | Peaks during washdown and shift change | Requires equalization before downstream stages |
For a broader view of equipment selection across vegetable and packaged-food operations, the F&B wastewater equipment buyer's guide covers the same strength bands in more detail.
The Garland Pretreatment Treatment Train
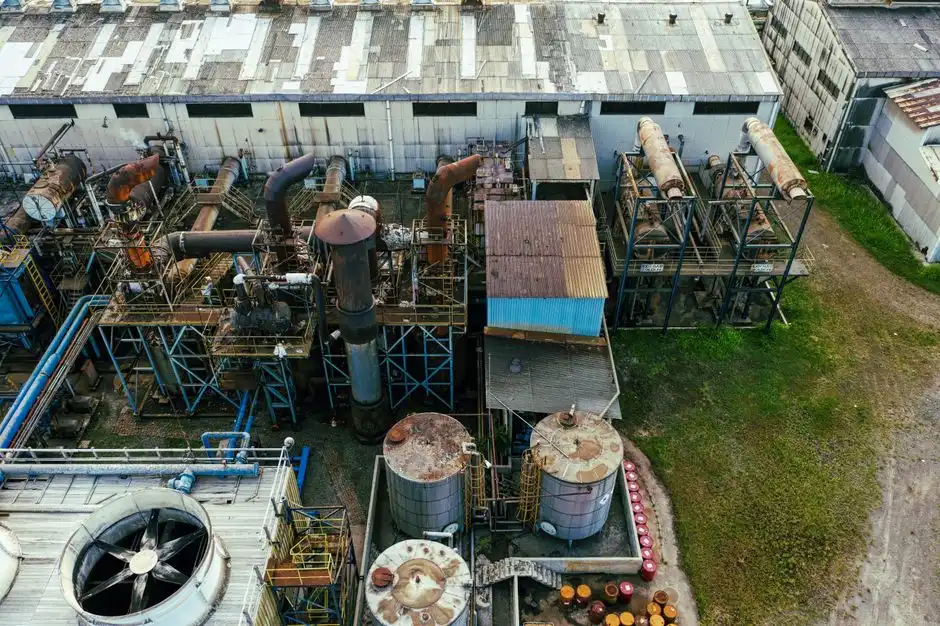
A defensible F&B pretreatment train follows the order a Garland IPP reviewer expects: front-end protection, flow conditioning, primary separation, biological reduction, and polishing. Each stage has a measurable job, and skipping one of them usually shows up as a permit excursion within a season.
Front-end screening comes first. A rotary bar screen for headworks removes rags, packaging debris, and food particles before they reach pumps, DAF equipment, or biological tanks — a non-negotiable step given the variability of food-processing waste (Hixson). Next, equalization and pH buffering: equalization basins blend CIP and process surges, while an automatic pH and coagulant dosing system flattens swings before downstream biology, because microbial performance collapses when pH moves outside the typical operating window (Crystal Clean).
DAF is the workhorse primary stage. A DAF system for FOG and suspended solids is the most widely deployed primary technology in food processing and removes the bulk of FOG and TSS before biological loading (Hixson). The biological stage then does the heavy lifting on COD/BOD: an MBR system for tight discharge limits combines biological treatment with membrane filtration for near-reuse effluent in a compact footprint, while anaerobic digestion is suited to very high-strength streams, with published COD removal of 89.8–96.5% in food-processing service and methane yields of 0.27–0.33 L CH₄ per gram of COD removed (Hixson; Integrated Water Services). Disinfection with UV or a chlorine dioxide generator protects downstream sewer biology, and sludge from DAF and clarifiers is dewatered with a sludge dewatering filter press for off-site disposal (Hixson).
| Stage | Primary Job | Documented Performance / Note |
|---|---|---|
| Screening | Remove large solids and debris | Protects pumps and downstream biology (Hixson) |
| Equalization / pH | Blend surges, flatten pH | Required for variable F&B flow (Crystal Clean) |
| DAF | FOG and TSS removal | Most widely used primary tech in food processing (Hixson) |
| Biological (MBR or anaerobic) | COD/BOD reduction | Anaerobic: 89.8–96.5% COD removal; 0.27–0.33 L CH₄/g COD (Hixson) |
| Disinfection / Solids | Polishing and sludge handling | UV or ClO₂; filter press for cake (Hixson) |
DAF vs MBR vs Anaerobic: Matching Technology to Your Plant
The right biological stage is a function of influent strength, flow, and the discharge limit the IPP sets — not a one-size-fits-all decision. DAF alone is the right fit for low-to-moderate strength streams where the IPP's BOD and TSS caps can be hit with primary solids/FOG removal plus off-site sludge hauling (Hixson; Crystal Clean). When the limit tightens, or the plant has a reuse target, DAF plus an MBR module is the standard path: MBRs combine biological treatment and membrane filtration for higher contaminant removal in a compact footprint (Integrated Water Services; Hixson). For very high-strength streams — high-COD dairy, brewery, or rendering waste — DAF plus anaerobic digestion pays back fastest because of the biogas yield, and the same published data show 0.27–0.33 L CH₄ per gram of COD removed alongside 89.8–96.5% COD removal (Hixson).
CAPEX and energy intensity rise with each step up the train, so plant managers should match the technology to the limiting parameter — BOD, TSS, nutrient, or reuse — rather than defaulting to the most advanced option. A useful MBR CAPEX and OPEX for food processing reference helps frame the cost step from DAF-only to DAF plus MBR.
| Train Configuration | Best Fit | Documented Strength |
|---|---|---|
| DAF only | Low–moderate strength, primary cap achievable | FOG/TSS removal; sludge hauled off-site (Hixson; Crystal Clean) |
| DAF + MBR | Tight limits, water-reuse goals, space-constrained sites | Higher contaminant removal in compact footprint (Integrated Water Services) |
| DAF + Anaerobic | Very high strength; biogas value supports ROI | 89.8–96.5% COD removal; 0.27–0.33 L CH₄/g COD (Hixson) |
Surcharge Math: The Real Cost of Doing Nothing
The simplest way to translate permit risk into CAPEX justification is to apply documented surcharge bands to a representative high-strength load. A worked example at roughly 100,000 gal/day discharging at approximately 2,000 mg/L BOD and 800 mg/L TSS — well within the 10–100× domestic range cited for food processing (Hixson) — produces a large monthly bill once the $1.32/mg/L BOD and $3.05/mg/L TSS fee structure is applied to the load above 250 mg/L (Hixson). The exact dollar figure scales with monthly discharge volume and the plant's actual surcharge tariff, so the inputs a buyer must request from Garland IPP are the current per-mg/L fee and the applicable cap, not an assumed number.
As a qualitative rule from the same reference, each meaningful 100 mg/L reduction in BOD or TSS above the cap saves meaningful monthly dollars, so even partial pretreatment (for example, DAF only) typically beats ongoing surcharges within a short payback window — the larger the strength gap above 250 mg/L, the faster the payback. Non-compliance costs compound beyond surcharges: increased monitoring, mandatory pretreatment installation orders, and possible permit revocation or production shutdown are all documented enforcement outcomes (Crystal Clean). Before finalizing CAPEX, request a facility-specific surcharge quote from Garland IPP because the city's per-mg/L fees and thresholds will drive the actual payback calculation rather than a reference benchmark. For broader context on managing high water volumes, see high water volume management best practices for manufacturing.
| Input | Worked Example Value | Source of Truth |
|---|---|---|
| Daily flow | ~100,000 gal/day (illustrative) | Plant flow meter |
| BOD / TSS | ~2,000 mg/L BOD; ~800 mg/L TSS | Site wastewater characterization |
| Surcharge tariff | $1.32/mg/L BOD; $3.05/mg/L TSS above 250 mg/L | Reference (Hixson); request Garland IPP quote for actual fees |
| Compliance cost if untreated | High monthly surcharge plus enforcement risk | Crystal Clean; garlandtx.gov |
Working with Garland IPP: Permit, Monitoring, and Reporting
Garland IPP inspects, issues permits to, and monitors industrial dischargers, with its legal authority rooted in City Ordinance and federal Section 307 (garlandtx.gov). Required deliverables typically include site-specific discharge limits, sampling frequency, monitoring reports, and adherence to the published IPP quarterly newsletter that flags rule changes and rule clarifications (garlandtx.gov). The IPP framework coexists with TCEQ state oversight and EPA pretreatment standards, so a plant must keep three documentation layers aligned rather than picking one and ignoring the others (Integrated Water Services; garlandtx.gov).
A pretreatment partner that handles sampling, manifests, and DMR-style reporting reduces the audit risk of a paper-trail gap when a new product line or season shifts wastewater characteristics (Crystal Clean). Practical sequencing for a Garland plant looks like this: characterize the stream with a lab profile, submit a permit application through IPP, install the train to the limits in the issued permit, and then run the sampling and reporting cadence the permit specifies. For a parallel view of pretreatment obligations outside Garland, this 2026 sewer discharge guide for industrial facilities walks through the same documentation layers in a different jurisdiction.
Frequently Asked Questions
What does a Garland F&B pretreatment system actually cost in 2026?
Cost depends on flow, influent strength, and the discharge limit in the issued IPP permit, so published reference ranges cannot be quoted without a site-specific wastewater characterization. The actionable check is to request a written surcharge quote from Garland IPP and a CAPEX proposal tied to your own BOD, TSS, and FOG profile rather than a benchmark number.
How do I pick the right supplier for a Garland F&B pretreatment project?
Pick a supplier who can deliver the full train (screening, equalization, DAF, biological, disinfection, sludge handling), provide site-specific wastewater characterization support, and take responsibility for IPP sampling and DMR-style reporting. The actionable check is to confirm in writing that the supplier holds documented reference installations in food processing with the same biological stage — DAF plus MBR or DAF plus anaerobic — your plant needs, and that they will sign off on permit deliverables.
Is DAF alone enough to meet Garland IPP discharge limits?
For low-to-moderate strength streams where the IPP's BOD and TSS caps can be hit with primary FOG and solids removal, DAF plus off-site sludge hauling is a defensible configuration (Hixson; Crystal Clean). For high-strength streams 10–100× domestic, DAF alone is rarely enough and a biological stage — MBR or anaerobic — is required to bring BOD/COD below the permit cap before discharge (Hixson).
What is the biggest operational risk once a Garland F&B pretreatment system is running?
The biggest operational risk is flow and load variability overwhelming a system sized for average conditions, because peak washdown and shift-change flows routinely exceed design capacity (Crystal Clean). The actionable mitigation is equalization with active pH buffering ahead of DAF and the biological stage, plus a sampling cadence that catches strength excursions before they trigger a surcharge or permit violation.