
What a Georg Fischer pre-FEED and FEED study actually delivers for UPW
A Georg Fischer pre-FEED or FEED study for a semiconductor ultrapure water (UPW) system is built on a documented set of design assumptions covering feed water quality, product purity targets, recovery, and utility consumption. Product water is sized to SEMI F63 limits: resistivity above 18.2 MΩ·cm at 25°C, total organic carbon below 1 ppb, and dissolved silica in the 0.2–1.0 ppb band, with dissolved oxygen held below 10 µg/L at the point of use. Feed-side assumptions include site-specific hardness, TOC, silica, and Silt Density Index so the pretreatment train can be designed. A single 300 mm fab typically assumes 2–4 million gallons per day of feed, 4.5–7 L of UPW per cm² of processed wafer, and a recovery target of 75–90%. Mass balance, chemical use, and energy are all carried as placeholders that are tightened once pilot data is available.
Pre-FEED is the feasibility stage. Its job is to fix the feed water envelope, the product purity band, a recovery range, and a Class 5 cost estimate (typically ±30–50%) before any pilot work is commissioned. At this point most of the numbers live in ranges and the deliverable is a process block diagram with a single-page assumption register. FEED is the stage that locks the treatment train, the mass balance, the utility consumption table, the layout envelope, and a Class 3–4 cost estimate (typically ±10–20%) that is good enough to support a final investment decision. The same UPW quality can be reached by several process routes, so the FEED record has to capture why a route was selected, not only the final figures, otherwise the basis-of-design cannot survive an internal review.
Georg Fischer scope sheets normally split the UPW system into four sub-systems, each carrying its own assumption sheet: pretreatment (multi-media filtration, softening, activated carbon, sometimes UF), primary (two-pass reverse osmosis, degasification, primary UV), polishing (continuous electrodeionization, mixed-bed polishers, polish UV, sub-200 nm final filters), and distribution (loop piping in PVDF or PP-lined stainless steel, point-of-use filters, dead-leg-free take-offs). The assumption register in this article is built around those four sub-systems so the reader can lift values directly into a GF-style scope sheet.
Feed water basis: the assumptions that drive pretreatment design
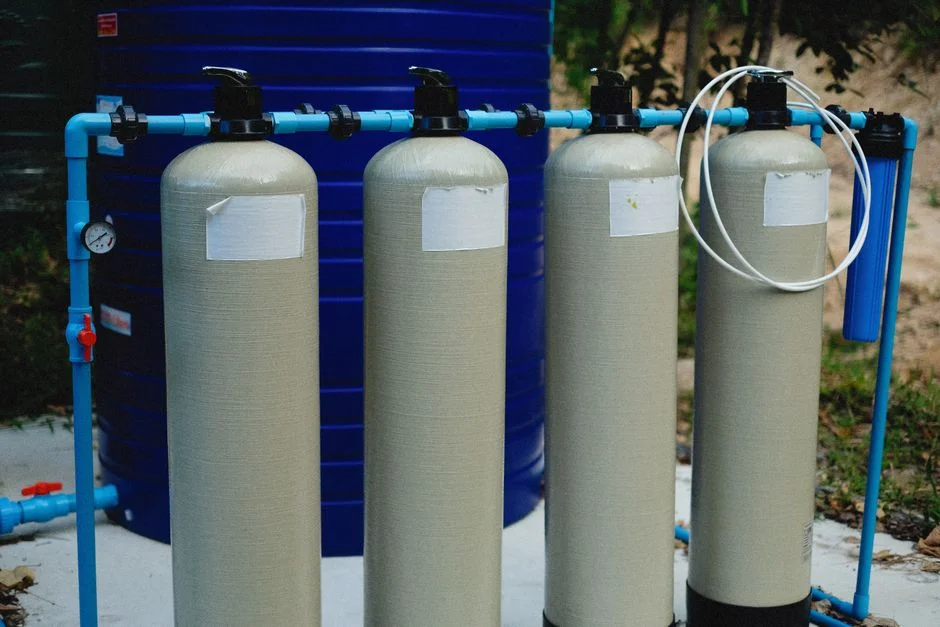
The feed water basis is the first register entry a Georg Fischer pre-FEED populates, because every downstream unit is sized off it. The standard parameters to capture are source type (groundwater, surface water, reclaimed municipal, reclaimed industrial), temperature range, pH, total hardness, alkalinity, TOC, dissolved and colloidal silica, iron and manganese, free chlorine, conductivity, and Silt Density Index. A multi-media pretreatment filter is then sized off the SDI and the iron/manganese loading rather than off the finished product specification.
Where feed comes from reclaimed municipal or industrial wastewater, the assumption register has to flag the small-molecule organic burden — urea, TMAH, and PFAS — that passes through conventional ion exchange, RO, and standalone UV, so advanced oxidation (UV-AOP or sulfate-radical) is carried as a FEED option rather than assumed away (S4). The pilot study in S5 treated semiconductor wastewater with UF plus two-stage RO, achieved more than 75% recovery and 0.5 mgC/L DOC, and the resulting RO permeate was confirmed at ≥18.2 MΩ·cm resistivity and below 1 ppb DOC at lab scale, which is a defensible placeholder for a reuse train. Feed demand must be sized at 1,400–1,600 gallons of feed per 1,000 gallons of UPW, so feed intake runs 40–60% above the product flow in the mass balance (S2).
| Parameter | Typical pre-FEED range | FEED tightening | Source |
|---|---|---|---|
| Source type | Groundwater / surface / reclaimed | Locked to a single source with seasonal envelope | S2, S4 |
| Temperature | Site range (°C) | Design min/max for RO flux | S2 |
| pH | 6.5–8.5 | Adjusted to 7.0–7.5 pre-RO | S4 |
| Total hardness | Site-specific as CaCO₃ | Softened to <1 ppm pre-RO | S2 |
| TOC | Site-specific mg/L | Drives AOP / UV sizing | S4 |
| Dissolved silica | Site-specific mg/L | Locked as RO scaling input | S2 |
| Iron / manganese | Site-specific | Oxidation + filtration basis | S4 |
| Free chlorine | Site-specific | Removed on carbon before RO | S4 |
| SDI (15 min) | Site-specific | Target <3 at RO feed | S2 |
| Reuse-train recovery | Range placeholder | Anchored to pilot (>75%, S5) | S5 |
Feed water seasonality and drought risk — particularly in Arizona, Texas, and Taiwan, where semiconductor capacity is concentrated — should be logged as a separate risk register entry rather than hidden in a single hardness number (S2). The fab's intake strategy (deep well vs. reclaimed) is the parameter that most often shifts between pre-FEED and FEED, and the assumption register has to leave room for it.
Product water basis: SEMI F63 and node-specific targets
The product water basis is what the fab holds the EPC to, so it has to be locked against SEMI F63 rather than a generic UPW definition. The advanced semiconductor envelope is resistivity above 18.2 MΩ·cm at 25°C, TOC below 1 ppb, dissolved silica 0.2–1.0 ppb, colloidal silica 0.3–2.0 ppb, particles above 0.05 µm below 0.3 per mL, and bacteria below 1 CFU/100 mL (S2, S4). These are the lines a reviewer will compare the operating data against, so they belong in the basis-of-design verbatim with a source tag.
Two less-quoted limits are normally carried in a separate row of the register because they are not on the standard F63 line item. Dissolved oxygen has to be below 10 µg/L at the point of use to prevent oxidation of wafer films and layers (S4). The particle size cutoff at the point of use is set to half the smallest feature size on the chip — for example, 20 nm cutoff for 40 nm features, with sub-200 nm final filters as the standard polish (S4). For 2 nm and 3 nm logic nodes the FEED assumption register should also record a tightened TOC line below 0.5 ppb (S2), because the current SEMI F63 envelope will not satisfy next-generation yield targets and the EPC will be asked about it in any client review.
| Parameter | SEMI F63 target | Node-tightened target | Measurement | Source |
|---|---|---|---|---|
| Resistivity | >18.2 MΩ·cm @25°C | Approach 18.18 MΩ·cm | Inline conductivity | S2, S4 |
| TOC | <1 ppb | <0.5 ppb (2/3 nm) | UV-persulfate oxidation | S2, S4 |
| Dissolved silica | 0.2–1.0 ppb | Sub-ppb locked | ICP-MS | S2 |
| Colloidal silica | 0.3–2.0 ppb | Sub-ppb locked | ICP-MS | S2 |
| Particles (>0.05 µm) | <0.3/mL | ≤ feature-size/2 | Laser particle counter | S2, S4 |
| Bacteria | <1 CFU/100 mL | <1 CFU/100 mL | Membrane filtration | S2 |
| Dissolved oxygen | <10 µg/L at POU | <10 µg/L at POU | Fluorescence / electrochemical | S4 |
The theoretical pure-water limits of 0.05501 µS/cm conductivity and 18.18 MΩ·cm resistivity at 25°C should be carried in the register as a calibration anchor for online meters, not as a daily operating target — 0.1 ppb of NaCl already drops resistivity to 18.11 MΩ·cm, so the difference between an operating point and the theoretical ceiling is the diagnostic band the fab will judge the polishing loop on (S4).
Demand and mass-balance assumptions for a 300 mm fab
The demand-side numbers anchor the whole mass balance, and they are the figures a Georg Fischer pre-FEED engineer will defend in the first client review. The baseline envelope is 2–4 million gallons per day of feed water for a 300 mm fab, with advanced fabs running 4.5–7 L of UPW per cm² of processed wafer (S2). A single 200 mm wafer needs about 5,600 L of UPW for cleaning, which is the number to reach for when the fab gives wafer-out rather than flow data (S2).
The mass balance has to show where the water actually goes. In the imec.netzero baseline for a 300 mm pilot line, CMP accounts for 31–48% of total UPW consumption and wet process classes account for 28–49% (S1). Those two classes dominate the demand profile and they are the ones a low-chemical wet clean option has to be benchmarked against. Recovery is carried as a placeholder: industry averages sit at 65–75%, next-generation fabs target 85–90%, and the S5 pilot confirms more than 75% is achievable today with UF plus two-stage RO (S2, S5). An industrial RO system sized off the feed basis sets the rejection flow that the rest of the plant has to handle.
Present the mass balance in three scenarios — minimum reuse, base reuse, and maximum reuse — rather than a single point estimate, so the sensitivity of the reject stream, the chemical load, and the energy bill is visible to the client. The reject flow is roughly 10–25% of feed at 75% recovery, and at 90% recovery the reject handling block (often a high-recovery RO or a ZLD option) starts to dominate the OPEX side of the basis-of-design (S2).
Utility, chemical, and energy assumptions at FEED
At FEED, the operating-cost register is populated per cubic meter of UPW delivered, not per cubic meter of feed, so the fab can benchmark against published numbers directly. The energy placeholder is 3–7 kWh per 1,000 gallons (roughly 0.8–1.8 kWh/m³) of UPW produced, with 20–25% of feed lost as reject during purification (S2). Chemicals to price in the register are NaOH and HCl for pH adjustment, antiscalant for RO, hydrazine or an alternative oxygen scavenger for the polish loop, and periodic hydrogen peroxide or ozone for sanitization (S2, S4). Polishing to more than 18.2 MΩ·cm is normally done with non-regenerable mixed-bed ion exchange or continuous electrodeionization polishing, so the consumable line is replacement resin or EDI stacks rather than acid and caustic regeneration (S4).
| Utility / chemical | FEED assumption | Notes | Source |
|---|---|---|---|
| Energy | 0.8–1.8 kWh/m³ UPW | 3–7 kWh/1,000 gal | S2 |
| Feed reject loss | 20–25% of feed | Tied to recovery target | S2 |
| NaOH / HCl | Dosing for RO feed pH | Continuous, low volume | S2 |
| Antiscalant | Site-specific dose | Set by silica / hardness | S2 |
| Oxygen scavenger | Hydrazine or alternative | Polish loop DO control | S4 |
| Sanitization | H₂O₂ or ozone, periodic | Bacteria control | S4 |
| Polishing consumable | EDI stacks / non-regen resin | No acid/caustic regen | S4 |
| UV sterilization | 185 nm + 254 nm | 9,000–12,000 h lamp life | S2 |
The environmental case for a low-chemical wet clean belongs in the register as an alternative scope: single-wafer backside cleaning (FOM) at imec demonstrated a 67% reduction in electricity, a 59% reduction in HF use, and a 31% reduction in UPW consumption compared to the conventional batch clean (S1). Carrying both the conventional and the FOM scope lines lets the fab choose between throughput and chemical load without re-running the FEED.
Materials, layout, and reuse-side assumptions
Materials and layout are where a UPW scope becomes buildable on the fab's plot, and they are often the assumptions a GF / Georg Fischer FEED has to defend to the owner's civil and mechanical reviewers. The polish and distribution loop is built in PVDF or PP-lined stainless steel to keep TOC and metals low, with sub-200 nm final filters at the point of use to meet the feature-size cutoff (S4). Redundancy assumptions have to be carried explicitly: N+1 for delivery pumps, dual polishing trains for fabs above about 50 m³/h of UPW, and a swing RO train so a single membrane change does not stop the line.
Reject and regeneration wastewater from RO, EDI, and mixed-bed polishing is a separate effluent stream from the fab's process drain, and on a water-stressed site a high-recovery RO block or a ZLD polish on the reject side should be carried as a FEED option rather than left to detailed design. A standalone ZLD plant buyer's guide is the right place to source the reject-side numbers, but the assumption here is that the reject stream is segregated, metered, and characterized separately from the start. The FEED plot plan should show the UPW room above any local flood level, with chemical dosing rooms on a separate ventilation zone, and the polish loop on a continuous recirculation path to prevent stagnation and bacterial growth (S4).
Pre-FEED vs FEED: a decision framework for the assumption register
The maturity split between pre-FEED and FEED is what allows the assumption register to be loose early and tight late without losing traceability. At pre-FEED, feed water quality is a range, product purity targets are SEMI F63 with a node-tighter line noted, and recovery is carried as a range (industry average 65–75% with a stretch to 85–90%); the deliverable is a process block diagram and a Class 5 cost (±30–50%). At FEED, recovery is fixed to a single value with one or two sensitivity cases, the treatment train is locked, utilities are priced to vendor quotes, and the cost estimate drops to Class 3–4 (±10–20%), which is the quality needed for FID (S2).
At both stages the basis-of-design register should tag every numerical assumption to its source — SEMI F63 for purity, the S2 demand and cost anchors, the S5 pilot for reuse-train recovery, the S1 imec data for the low-chemical wet clean — so a reviewer can audit a number without chasing footnotes. A single register page that maps each row to its reference is the cheapest way to survive a client review.
| Assumption | Pre-FEED | FEED | Source tag |
|---|---|---|---|
| Feed water quality | Range with seasonal envelope | Single value with sensitivity | Site data, S2 |
| Product purity | SEMI F63 line + node flag | Locked, with node-tightened TOC | S2, S4 |
| Recovery | 65–75% base, 85–90% stretch | Fixed value + sensitivity | S2, S5 |
| Energy | 0.8–1.8 kWh/m³ UPW | Vendor-quoted kWh/m³ | S2 |
| Reuse-train performance | >75% recovery placeholder | Pilot-confirmed value | S5 |
| Wet-clean scope | Conventional vs FOM carried | One option selected | S1 |
| Cost estimate class | Class 5 (±30–50%) | Class 3–4 (±10–20%) | GF project standard |
Frequently Asked Questions
What budget envelope should we carry for a new semiconductor UPW system at pre-FEED?
For a single greenfield fab, the S2 commercial reference gives a single-fab CAPEX envelope of $1B–$4.6B, with annual water expense reported in the $2M–$8M range depending on capacity and local water cost. The UPW system itself is a fraction of that envelope, so the buyer should request a UPW-specific split from the EPC at pre-FEED rather than backing the figure out of the fab total.
How do we assess supplier risk and lead time for the polish loop?
EDI stacks and UV lamps dominate both delivery and service contracts for the polish loop. Lamp service life is published at 9,000–12,000 hours, and EDI modules are voltage-driven consumables with defined replacement intervals (S2). The buyer should request a spare-stack and lamp holding agreement from the supplier, plus the regional service response time in writing, before locking the FEED.
How do we handle compliance risk in water-stressed regions between pre-FEED and FEED?
Feed water seasonality in Arizona, Texas, and Taiwan has already pushed fabs to consider reclaimed municipal and industrial sources (S2, S4). The compliance risk is that the operating envelope at FID is materially different from the one at pre-FEED. The buyer should require a documented drought and intake-permit scenario in the FEED risk register, with the reuse-train recovery anchored to a pilot result (S5 shows more than 75% with 0.5 mgC/L DOC) rather than a literature range.
How do we size a UPW system when only wafer-out data is available?
Use the per-wafer anchor of about 5,600 L of UPW per 200 mm wafer (S2), and the per-area anchor of 4.5–7 L of UPW per cm² of processed wafer for advanced fabs, to back-calculate feed demand. Apply the 1,400–1,600 gallons of feed per 1,000 gallons of UPW ratio to size raw water intake and pretreatment, then run three recovery scenarios (minimum, base, maximum) so the reject block is sized for the worst case the fab might commit to (S2).