A 2026 data center in Kakamega needs three hydraulically separate treatment trains, not one combined plant
Stream 1 is raw-water intake from local supply in the Lake Victoria basin, with TDS expected in the 500–1,200 mg/L inland Kenya band (HydropureWater field data, 2026), routed through screening, multi-media filtration to SDI <3, antiscalant and chlorine dioxide dosing, and brackish RO at 50–70% recovery. Stream 2 is cooling-tower blowdown, the largest treatable volume, handled with lamella clarification, side-stream softening that raises cycles of concentration from 2–3 to 4–6, on-site chlorine dioxide for biofilm control within the NEMA THM limit of <0.1 mg/L, and optional RO at 50–85% recovery.
Stream 3 is sanitary sewage at roughly 100 L per employee per day and BOD₅ 200–300 mg/L, isolated to a small WSZ A/O package plant. All three discharge under a NEMA effluent discharge licence under the Water Quality and Management Act, typically taking 60–120 days to issue, with WUE aligned to the Climate Neutral Data Centre Pact cap of 0.4 L/kWh (January 2025). Wet cooling is feasible year-round, so zero liquid discharge is not economic.
Why Kakamega Is Not a Nairobi or Mombasa Template
Kakamega sits in the Lake Victoria basin, and intake water drawn from local supply and basin tributaries analyses in the inland Kenya brackish band at TDS 500–1,200 mg/L (HydropureWater field data, 2026), not the Mombasa baseline above 1,500 mg/L. That single shift changes the RO recovery envelope, the antiscalant dose, and the side-stream softener sizing, and it invalidates any coastal template the procurement team may be carrying.
The annual rainfall and ambient temperature profile in the Lake Region also differ from the Athi River / NCWSC and coastal sites. A 5 MW IT load at 20–28 °C ambient loses 150–250 m³/day to evaporation (HydropureWater field data, 2026), and the cooling-tower fan and heat-exchanger selection must be re-checked against the local ASHRAE TC 9.9 class rather than a coastal or highland reference.
Inland logistics from Mombasa port to western Kenya carry a 25–40% premium over Asian or European CIF supply (HydropureWater field data, 2026), and need to be priced in at the RFQ stage, not at delivery. A 5 MW site selecting a Nairobi or Mombasa reference without correcting for the western Kenya logistics premium will land late and over budget.
The Three Wastewater Streams a Kakamega Data Center Produces
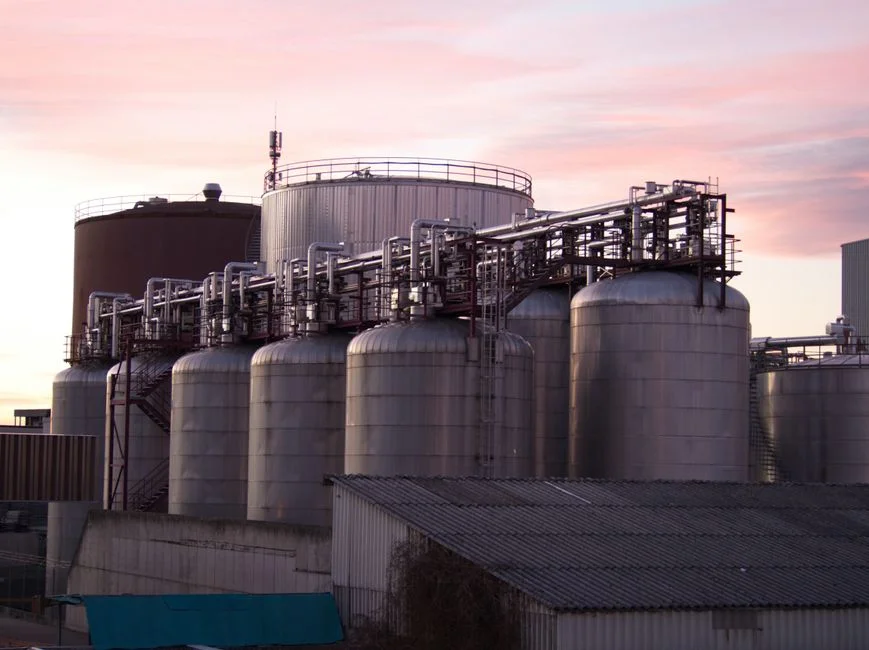
A Kakamega data center produces three hydraulically separate waste streams. Stream 1 is raw-water intake at TDS 500–1,200 mg/L with variable suspended solids in the rainy season, conditioned to cooling-tower makeup and facility service water. Stream 2 is cooling-tower blowdown (CTBD) at TDS 1,200–6,000 mg/L, biocide-bearing, silica and calcium hardness-loaded, and the largest treatable volume on the site. Stream 3 is sanitary sewage at BOD₅ 200–300 mg/L, pathogen-bearing, approximately 100 L per employee per day, reducing and biological in character.
The mechanical reason to keep them separate is straightforward: CTBD is oxidizing and mineral, sanitary sewage is reducing and biological. One technology cannot handle both without re-dosing the other side, and combining them in a shared equalization tank destroys CTBD reuse economics and forces a full biological plant on a stream that is already pathogen-controlled upstream. The NEMA reviewer will also reject a combined discharge application because one stream's exceedance then triggers the other's permit action.
| Parameter | Stream 1 — Raw-Water Intake | Stream 2 — CTBD | Stream 3 — Sanitary Sewage |
|---|---|---|---|
| Chemistry character | Fresh-to-brackish mineral | Oxidizing, mineralized | Reducing, biological |
| Typical TDS | 500–1,200 mg/L (HydropureWater field data, 2026) | 1,200–6,000 mg/L | Low (ionic), BOD₅ 200–300 mg/L |
| Key constituents | Variable suspended solids, silica, hardness | Silica, Ca-hardness, residual biocide | Pathogens, organics, nitrogen |
| Relative volume | Site intake, feed for makeup | Largest treatable volume | Low, ~100 L/employee/day |
| Discharge route | To cooling-tower makeup / service water | NEMA boundary, separate sampling point | NEMA boundary, separate sampling point |
Raw-Water Pretreatment Train for the Lake Basin Intake
Specify the raw-water train in the order it should appear on a P&ID, not the order it appears in a vendor catalogue: intake screening, a multi-media filter ahead of brackish RO sized for SDI <3, a PLC-controlled antiscalant dosing skid, an on-site chlorine dioxide generator at 0.3–0.5 mg/L on the intake, then a brackish RO system at 50–70% recovery. The raw-water train is the single largest determinant of RO membrane life on an inland site, and a multi-media filter sized for a steady tropical design number will fail in the long rainy season when basin tributary turbidity spikes.
Antiscalant dose is set against the Langelier Saturation Index of the blend entering the RO banks, not against a generic vendor curve. Chlorine dioxide at 0.3–0.5 mg/L on the intake prevents biofouling without forming trihalomethanes, which the NEMA effluent discharge licence schedule keeps below 0.1 mg/L at the discharge boundary. Brackish operation in the 500–1,200 mg/L band is comfortable for standard thin-film composite membranes at 150–250 psi; the design constraint is not pressure but pretreatment consistency. Skipping the multi-media filter and relying on cartridge filters alone is the most common cause of premature membrane replacement on inland Kenya sites.
Cooling-Tower Blowdown Train: Lamella, Softener, ClO₂, and RO
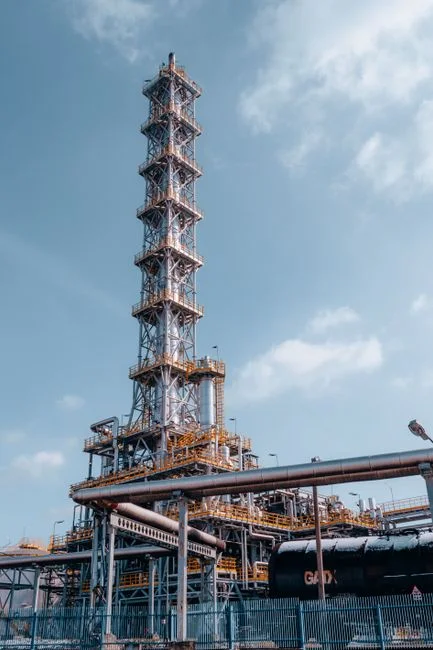
Cooling-tower blowdown is the largest single treatable stream on a Kakamega campus. Evaporation loss for a 5 MW IT load at 20–28 °C ambient runs 150–250 m³/day (HydropureWater field data, 2026); without blowdown, hardness, silica, and TDS climb until scaling and biological fouling shut the tower down.
The treatment chain runs: a lamella clarifier for CTBD polishing with automatic chemical dosing to drop TSS and silica carryover, then a side-stream softener on the circulating water that raises the practical cycles-of-concentration ceiling from 2–3 to 4–6 without aggressive chemical dosing, an on-site chlorine dioxide generator at 0.5–1.0 mg/L for biofilm control within the NEMA THM limit of <0.1 mg/L, and at the upper end an industrial RO on cooling-tower blowdown at 50–85% recovery producing permeate at TDS 10–50 mg/L and 150–400 psi feed pressure, antiscalant-protected, with permeate blended back into cooling-tower makeup at 30–50% raw-water cut.
Conventional BWRO is capped at 75–80% recovery before scaling becomes unmanageable (per IDE, 2026); pushing higher needs controlled salt precipitation or dynamic RO operating modes that sit outside standard procurement. Size the blowdown storage tank for at least 24 hours of peak evaporation loss to absorb intermittent heat-load transients during grid instability events.
| CTBD Train Stage | Equipment | Design Target / Output |
|---|---|---|
| Clarification | Lamella clarifier with chemical dosing | TSS and silica carryover reduction |
| Softening | Side-stream softener | Hardness cut to <40 mg/L as CaCO₃; CoC raised from 2–3 to 4–6 |
| Disinfection | On-site chlorine dioxide generator | 0.5–1.0 mg/L residual, no THM formation; NEMA THM <0.1 mg/L at boundary |
| RO polish (optional) | Brackish RO on blowdown | 50–85% recovery, 150–400 psi, permeate TDS 10–50 mg/L, 30–50% raw-water cut blend |
Sanitary Sewage: Keep It Off the CTBD P&ID
Sanitary sewage is organic, low-flow, and pathogen-bearing at BOD₅ 200–300 mg/L; it cannot be combined with the oxidizing, mineralized CTBD stream. Route it to a WSZ A/O package plant sized at approximately 100 L per employee per day, buried or skid-mounted, no on-site operator. Sludge volumes from a 50–150-person Kakamega workforce are too small to justify a centrifuge; a small plate-and-frame filter press handles dewatering at the right scale.
Discharge from the WSZ unit routes to the NEMA effluent discharge licence boundary at a separate sampling point from the CTBD. Sharing a sampling point forces one stream's exceedance to trigger the other's permit action and is rejected at the application stage. The two streams must remain hydraulically separate from the building drain to the licensed discharge manhole.
The Cycles-of-Concentration Math, Corrected
The cycles-of-concentration (CoC) instinct is wrong, and the math is the only thing that fixes it. Blowdown as a fraction of makeup water is 1/(CoC − 1). At 4 CoC, blowdown equals 25% of makeup water. At 6 CoC, blowdown drops to 20% — a 5 percentage-point reduction, a 20% cut in blowdown volume, not the 50% that linear intuition suggests (per Genesis, 2025). Sustainability directors who mandate a 4→6 CoC step expecting a 50% freshwater cut will underwrite a chemistry spend that delivers a 20% cut and then wonder why the WUE number did not move.
Biological and scaling risks increase exponentially above 5–6 CoC without advanced treatment, so the practical ceiling sits at 4–6 on a Kakamega campus without RO polish. Run a CoC economic curve before sizing the softener: a 4→6 step is a 5 pp cut on its own, but it can unlock a 30–50% raw-water cut when paired with side-stream softening, lamella polishing, and RO on blowdown, depending on the chemistry. Conventional 75–80% recovery is the BWRO scaling ceiling (per IDE, 2026); pushing higher requires controlled precipitation or a dynamic RO operating mode that does not sit in a standard procurement envelope. The credible 2026 target band for a 5 MW Kakamega site is 30% raw-water cut at the lower end and 50% at the upper end.
NEMA Permit, WUE, and the Wet-Cooling vs ZLD Decision
The NEMA effluent discharge licence under the Water Quality and Management Act is the binding permit; it typically takes 60–120 days from application to issue, depending on the completeness of the Environmental Impact Assessment and the quality of the discharge characterization data (HydropureWater field data, 2026). The application requires stream-by-stream characterization of TDS, BOD₅, TSS, residual chlorine, heavy metals, and temperature; a process flow diagram showing each stream to the licensed discharge manhole; and proof that discharge limits meet the NEMA Water Quality Regulations 2006 schedule for the receiving environment (sewer, land, or watercourse).
Align the WUE target to the Climate Neutral Data Centre Pact cap of 0.4 L/kWh (January 2025). ZLD is not economic for a Kakamega data center in 2026: wet cooling is feasible year-round in the Lake Victoria basin ambient envelope, and ZLD adds 25–40% CAPEX with no operating benefit (HydropureWater field data, 2026). Where corporate water-stewardship commitments require ZLD regardless of payback, the brine concentrate from a high-recovery RO stage can be routed to an evaporator-crystallizer as a separate CAPEX line, but it should be priced and permitted as an add-on, not folded into the base three-stream train.
2026 Cost Band for a Kakamega Data Center Treatment Train
Frame the 2026 cost band as a range, not a single number. The full three-stream process train — raw-water pretreatment, CTBD, sanitary sewage — lands in the low single-digit USD millions for CAPEX, process equipment only, excluding site civil works and generator backup (HydropureWater field data, 2026). OPEX is dominated by chemical dosing, antiscalant, RO membrane replacement, and biocide, and is best framed as $/m³ treated against the local utility tariff to give a CFO a clean ROI conversation.
Inland logistics from Mombasa port to western Kenya carry a 25–40% premium over Asian or European CIF supply (HydropureWater field data, 2026) and must be priced in at the RFQ stage, or they will land late. Civil works, generator backup, and the NEMA licence fee sit outside the band and should be carried as separate procurement lines. For a comparable inland cost frame, see the Sapporo data center wastewater 2026 guide; for a tropical high-rainfall reference, see the Curitiba data center blowdown 2026 guide.
| Cost Line | 2026 Envelope (HydropureWater field data, 2026) | Notes |
|---|---|---|
| Full three-stream process train (CAPEX, equipment only) | Low single-digit USD millions | Excludes site civil works and generator backup |
| Raw-water pretreatment (intake, MMF, dosing, BWRO) | Inside the CAPEX band | 5–10 m³/h class, SDI <3, 50–70% recovery |
| CTBD train (lamella, softener, ClO₂, RO) | Inside the CAPEX band | 50–85% RO recovery, 4–6 CoC with side-stream softener |
| Sanitary sewage (WSZ A/O + plate-frame press) | Inside the CAPEX band | Sized at ~100 L/employee/day |
| Inland logistics premium (Mombasa → western Kenya) | 25–40% over Asian/European CIF | Price in at RFQ stage |
| OPEX (chemicals, membranes, biocide, power) | Frame as $/m³ treated vs utility tariff | Excludes labour |
| Excluded lines | Civil works, generator backup, NEMA licence fee | Carry as separate procurement lines |
Frequently Asked Questions
What intake water envelope should a Kakamega site plan for?
Plan for TDS 500–1,200 mg/L in the Lake Victoria basin tributaries and local supply (HydropureWater field data, 2026), with a multi-media filter ahead of the RO and antiscalant set against the Langelier Saturation Index of the actual blend. The rainy-season turbidity spike is the design constraint, not pressure.
How long does the NEMA effluent discharge licence take, and what is the compliance risk if a stream is mischaracterised?
A NEMA effluent discharge licence under the Water Quality and Management Act typically takes 60–120 days from application to issue, depending on EIA completeness and discharge characterization quality (HydropureWater field data, 2026). Submitting combined-stream characterization for CTBD and sanitary sewage is rejected at the application stage because one stream's exceedance then triggers the other's permit action; request a stream-by-stream characterization template from the consultant before the EIA is drafted.
Is ZLD required or economic for a Kakamega site in 2026?
No. Wet cooling is feasible year-round in the Lake Victoria basin ambient envelope, and ZLD adds 25–40% CAPEX with no operating benefit (HydropureWater field data, 2026). Where a corporate mandate requires ZLD regardless of payback, price the evaporator-crystallizer as a separate CAPEX line and confirm the NEMA brine disposal pathway before the RFQ goes out.
What $/m³ treated line item should a CFO see, and what supplier shortlisting criteria actually matter?
For OPEX, ask the vendor for a $/m³ treated line item broken out by chemical dosing, antiscalant, RO membrane replacement, and biocide, benchmarked against the local utility tariff rather than a vendor slide. For supplier shortlisting, require documented inland-Kenya project references (not just East Africa), a written commitment to the 25–40% inland logistics premium priced into the RFQ rather than added at delivery, and a process guarantee that names SDI <3 at the RO feed, CoC 4–6 with side-stream softening, and NEMA THM <0.1 mg/L at the discharge boundary. Verify that the bidder has commissioned at least one BWRO train in the 500–1,200 mg/L TDS band before accepting the proposal.