
Why Brewery Effluent Is a High-Strength COD Problem
Brewery wastewater is a high-strength industrial effluent because the brewing process concentrates sugars, soluble starch, yeast residues, ethanol and volatile fatty acids into a single dilute stream, and the cleaning cycle adds phosphorus from caustic and phosphoric chemicals. The 2026 COD and SS engineering guide defines COD as the standard mass-based measure of oxidisable organics in mg/L, a parameter that captures the bulk of the brewery load in a single number.
The design challenge is that the raw number is not stable. Moyakhe (2019) characterised three real brewery samples at pH 5.12, 7.86 and 12.84 and reported COD of 10,524.7 mg/L, 3,493 mg/L and 2,293.5 mg/L respectively, with turbidity of 1,829, 464.25 and 609.7 NTU and a negative zeta potential in all three. A 2026 laboratory study on an acidic high-strength effluent (Membranes, July 2026) measured 48,230 mg/L COD, 34,160 mg/L BOD₅ and 6,492 mg C/L DOC, an order of magnitude above the Moyakhe high-COD sample. The pH swing is the driver: returned unsold fermenting product drops the stream to pH 5.12 and pushes COD above 10,000 mg/L, while caustic-based cleaning pushes pH to 12.84 and drops the apparent COD because the high-pH chemistry oxidises a fraction of the organics before the sample is taken (Moyakhe 2019). Sizing a single train from any one of these numbers without a 24-hour composite is a frequent engineering error on brewery projects.
Biological SBR Performance: What Published Efficiencies Actually Show
An anaerobic–aerobic sequencing batch reactor (SBR) on real brewery wastewater delivered 54% total COD removal and 69% orthophosphate removal at SRT 7 d, HRT 18 h, mesophilic 25 °C, and an organic volumetric loading rate of 1.14–4.83 kg COD/m³·d, with a 4 h anaerobic phase and 14 h aerobic phase in a 22 L PVC reactor at 13 L working volume (Fermentation, June 2022). This bench-scale SBR serves as a performance baseline. Higher SBR results are reported in the same study: Shao et al. achieved 90% COD on an anaerobic SBR at HRT 24 h and SRT 60 d over an OVLR of 1.5–5.0 kg COD/m³·d, and Wang et al. reported 88% COD on an aerobic/anoxic SBR at HRT 15 h and SRT 90 d. The Wang et al. caveat is critical for procurement meetings: the 88% removal still left reactor effluent total COD at 346 mg/L, a value above the dewatering limits referenced in Fermentation (2022). A biological SBR removes the biodegradable fraction and leaves slowly biodegradable particulate COD plus refractory organics in solution, so a downstream polishing stage is required when the discharge or reuse target sits below 120 mg/L.
| SBR configuration | Reported COD removal | HRT | SRT | OVLR (kg COD/m³·d) | Residual COD / note | Source |
|---|---|---|---|---|---|---|
| Anaerobic–aerobic, 22 L PVC, 25 °C | 54% TCOD | 18 h | 7 d | 1.14–4.83 | — | Fermentation 2022 |
| Anaerobic SBR | 90% COD | 24 h | 60 d | 1.5–5.0 | — | Shao et al., in Fermentation 2022 |
| Aerobic/anoxic SBR | 88% COD | 15 h | 90 d | — | Effluent 346 mg/L TCOD, above dewatering limits | Wang et al., in Fermentation 2022 |
Coagulant and Flocculant Polishing on Brewery COD
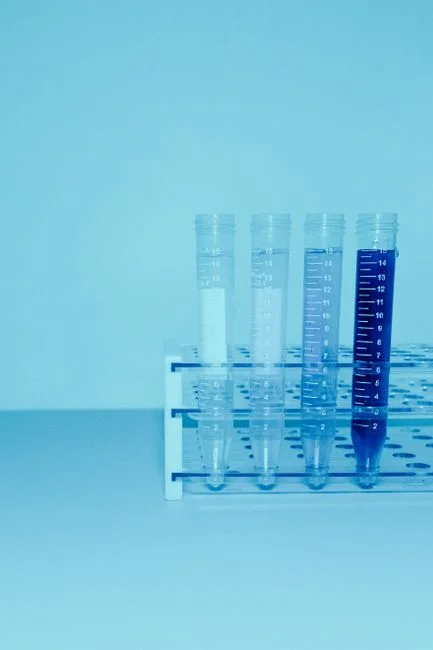
The Moyakhe (2019) dataset provides a pH-by-pH benchmark for chemical polish on real brewery effluent. At pH 5, ferric chloride paired with a non-ionic flocculant at an optimum 10 ppm dosage removed 39.66 mg COD per ppm of coagulant, and the brewery-specific coagulant paired with a non-ionic flocculant at the same pH and dosage removed 39.55 mg COD per ppm. The pH penalty is significant: ferric chloride plus anionic flocculant fell from 38.12 mg COD per ppm at pH 5.12 to 27.80 at pH 7.86 and 14.69 at pH 12.84, so a high-pH caustic wash stream effectively halves the chemical yield. The optimum-dosage pattern follows this trend: at pH 5, only 5–10 ppm flocculant was needed with ferric chloride, while at pH 12.84 optimum dosages jumped to 30–50 ppm depending on the flocculant, indicating a cost benefit to pH correction before dosing. The 2026 coupled-train study (Membranes, July 2026) used PIX 113 coagulant at 2 mL/L to destabilise colloids immediately upstream of a 50 kDa ceramic UF, confirming that chemical conditioning remains necessary when a downstream membrane is planned. Coagulation and flocculant selection is best run on an automatic chemical dosing skid so that the dose tracks the actual influent load rather than a fixed setpoint.
| Coagulant + flocculant | pH 5.12 (mg COD / ppm) | pH 7.86 (mg COD / ppm) | pH 12.84 (mg COD / ppm) | Optimum dosage, pH 5.12 (ppm) | Source |
|---|---|---|---|---|---|
| Ferric chloride + anionic | 38.12 | 27.80 | 14.69 | 5 | Moyakhe 2019 |
| Ferric chloride + cationic | 36.36 | 27.75 | 11.08 | 40 | Moyakhe 2019 |
| Ferric chloride + non-ionic | 39.66 | 26.54 | 4.66 | 10 | Moyakhe 2019 |
| Brewery coagulant + non-ionic | 37.43 | 28.97 | 10.78 | 50 | Moyakhe 2019 |
Coupled Coagulation, Ceramic Membrane and RO Train
The highest-removal train reported on real brewery wastewater in 2026 couples sedimentation, prefiltration, coagulation (PIX 113 at 2 mL/L), 50 kDa ceramic ultrafiltration, and reverse osmosis, achieving 97.9% COD, 98.6% BOD₅, 94.0% DOC, 92.5% chloride and 68.5% nitrate removal on an effluent that started at 48,230 mg/L COD (Membranes, July 2026). The same train ending in a 1 kDa ceramic UF without the RO stage reached 78.2% COD, 88.7% BOD₅ and 49.8% DOC. These results illustrate the function of each barrier: sedimentation and prefiltration removed only a limited fraction, coagulation destabilised the colloids so the 50 kDa ceramic UF could operate at stable flux, the 50 kDa UF stripped the bulk of the colloids and large organics, and the RO removed the residual COD, BOD and DOC. The trade-off is that RO delivers the extra ~20 percentage points of COD removal over 1 kDa UF alone and pulls chloride removal to 92.5%, but it also adds the energy, concentrate disposal and pretreatment burden that an engineer must account for. For the UF and RO stages, a PVDF ultrafiltration system ahead of an industrial RO system matches the configuration reported in the 2026 paper.
| Train configuration | COD removal | BOD₅ removal | DOC removal | Chloride removal | Source |
|---|---|---|---|---|---|
| Sedimentation + prefiltration + coagulation + 50 kDa ceramic UF + RO | 97.9% | 98.6% | 94.0% | 92.5% | Membranes, July 2026 |
| Sedimentation + prefiltration + coagulation + 1 kDa ceramic UF (no RO) | 78.2% | 88.7% | 49.8% | — | Membranes, July 2026 |
Matching the Train to the Compliance Target
The compliance envelope for a brewery plant exporting to sewer or surface water sits below 120 mg/L COD in the EU and below 50 mg/L COD in China (HydropureWater, 2026), with reuse targets set by the RO ceiling demonstrated in the 2026 coupled train. Selection logic works backwards from the target. On a raw COD band of 2,500–3,500 mg/L near neutral pH, an SBR alone at 54% (Fermentation 2022) is unlikely to clear 120 mg/L without polish, and even the 88% Wang et al. SBR result left 346 mg/L in the reactor effluent, requiring a downstream ceramic or RO barrier. On a raw COD near 10,500 mg/L at pH 5, coagulant plus non-ionic flocculant at ~10 ppm delivers a partial polish (Moyakhe 2019), but biological polishing is still required to drop the biodegradable fraction below compliance. On a raw COD near 48,000 mg/L — the Membranes 2026 influent — only the full coupled train of coagulation, 50 kDa ceramic UF and RO clears the bar in a single step. These published efficiencies should not be extrapolated without a treatability trial on a representative 24-hour composite, and the polishing stage should be sized with measurable margin against the discharge limit. A high-efficiency sedimentation tank upstream of the biological stage keeps the SBR feed consistent and protects the downstream membrane from solids shock.
Frequently Asked Questions
What raw-COD envelope should a brewery plant engineer size the train from?
Published brewery influent COD ranges from 2,293.5 mg/L at pH 12.84 to 48,230 mg/L on an acidic high-strength stream (Moyakhe 2019; Membranes, July 2026), so a single design number is unsafe. The actionable check is to fix a 24-hour composite influent profile covering COD, BOD, TSS, pH, temperature, FOG and salinity before requesting quotes.
Why does an SBR-only train often fail the dewatering or reuse limit despite high reported COD efficiency?
The Wang et al. aerobic/anoxic SBR cited in Fermentation (2022) reported 88% COD removal at HRT 15 h and SRT 90 d, yet the reactor effluent total COD was 346 mg/L — a value above the dewatering limits referenced in the same study. The actionable check is to translate any percentage efficiency into a residual COD number using the actual 24-hour composite, and to include a polishing barrier whenever that residual exceeds the discharge or reuse limit.
How does pH change coagulant performance, and what should the procurement document specify?
Moyakhe (2019) reported ferric chloride plus non-ionic flocculant removing 39.66 mg COD per ppm at pH 5 but only 4.66 mg COD per ppm at pH 12.84, with optimum flocculant dosage rising from 10 ppm to 40 ppm across the same pH swing. The actionable check is to specify pH correction ahead of the dosing point in the enquiry document so that all suppliers quote against the same influent condition.