
MSGW Influent Envelope and Why Biology Must Lead
Raw monosodium glutamate fermentation wastewater arrives at the treatment works with one of the most punishing envelopes in industrial effluent: COD 10,000–30,000 mg/L, NH4+–N 15,000–25,000 mg/L, SO4²− 15,000–30,000 mg/L, and pH 1.5–2.5 (S3, Resources, Conservation and Recycling, 2004; UASB data in S5 confirms the COD and pH ranges in 2010 bench trials). Independent characterization at Vedan Enterprise, Taiwan, recorded total N 56.7 g/L, organic C 344.6 g/L, and total solids 600 g/L (S5) — the reason Yang et al. and the S5 authors describe MSGW as "ineffective for direct biological treatment" without a buffer or pre-acidification step. A generic 0.03 µm PVDF UF datasheet designed for municipal tertiary polishing will foul inside hours on this liquor.
Biology must go first. The successive yeast + activated sludge (AS) train documented in S3 removed roughly 95% of influent COD and raised pH from 2.5 to 5.0–6.0 at a 40 h HRT. UASB pilots in S5 delivered 57.0–79.6% COD removal on influents of 11,878–16,922 mg/L. Either path exits biology at 360–1,300 mg/L COD with about 70 mg/L suspended solids — mostly residual yeast and soluble protein. That residual is exactly the fraction a 0.01–0.1 µm PVDF ultrafiltration stage is built to capture, and it is the envelope the post-biology UF in the rest of this guide is sized against.
| Parameter | Raw MSGW (S3, 2004) | Post yeast + AS (S3) | Post UASB (S5) | UF feed target |
|---|---|---|---|---|
| COD (mg/L) | 10,000–30,000 | ~500–1,300 | 2,400–7,300 (on 11,878–16,922 in) | 360–1,300 |
| NH4+–N (mg/L) | 15,000–25,000 | high residual | not reported | site-specific |
| SO4²− (mg/L) | 15,000–30,000 | largely unchanged | not reported | largely unchanged |
| pH | 1.5–2.5 | 5.0–6.0 | acidic | 6.0–7.0 (adjusted) |
| Suspended solids (mg/L) | 600 g/L total solids reported in S5 | ~70 | low | <70 after DAF |
Two UF Positions on a 2026 MSGW Train: Post-Biology vs Pre-Biology
UF earns its place in one of two positions on a modern MSGW train, and the choice changes both the mass balance and the revenue case. The dominant 2026 configuration is post-biology UF: the activated sludge or UASB effluent is pH-adjusted to 6–7, passed through a strainer and a dissolved-air flotation unit for bulk TSS stripping, then through hollow-fiber PVDF UF that captures residual yeast biomass and the soluble protein fraction. UF permeate (typically COD < 500 mg/L, turbidity < 1 NTU) feeds a brackish-water RO for reuse or direct cooling-tower make-up. The retentate — a protein concentrate — is the new product line.
The second configuration is pre-biology UF, used when fermenter product recovery is the priority rather than wastewater polishing: fermenter broth is sent directly through UF, the retentate is returned to the crystallizer for residual glutamate capture, and the permeate feeds the yeast contact oxidation stage. This configuration converts the 55.8% crude-protein biomass documented in S3 from a wasted sludge into a recovered single-cell protein (SCP) concentrate. When upstream COD into the UF exceeds ~5,000 mg/L — common in pre-biology duty — a coagulation stage ahead of UF is mandatory. S3 bench data shows FeCl3 at 1,400 mg Fe/L drops post-biology COD from 1,300 to 360 mg/L, and the same iron dose protects UF membrane pore geometry from organic overload. Pair the coagulation step with a matched PLC-controlled coagulant dosing skid so the iron dose holds within the band the membrane can tolerate.
Membrane Specification: Pore Size, MWCO, and Module Chemistry
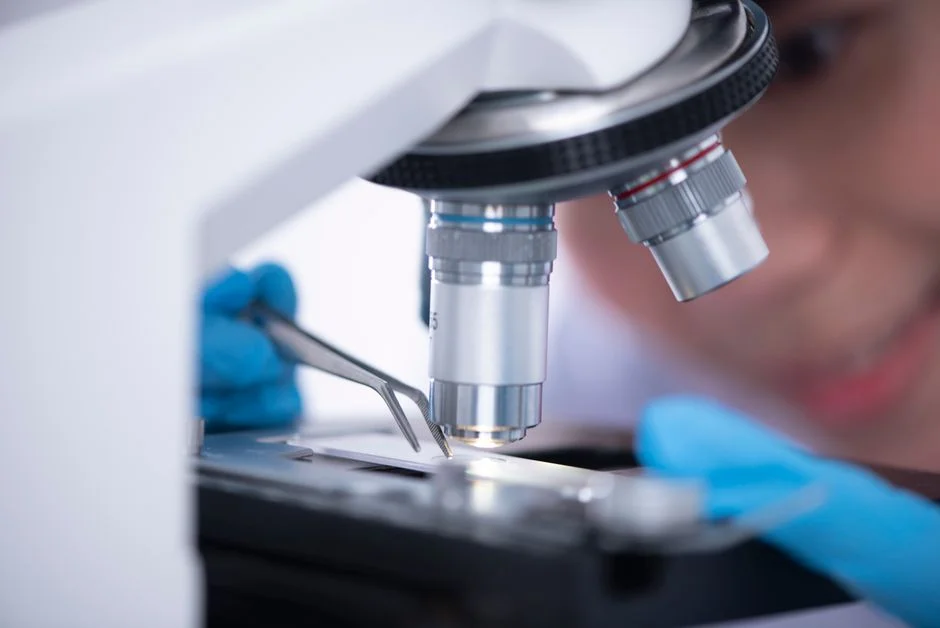
The membrane spec below is the realistic 2026 window for MSGW duty, not a generic municipal UF datasheet. Pore size 0.03–0.1 µm combined with MWCO 100–150 kDa is the right size envelope: large enough to pass monovalent ions (Na+, Cl−, NH4+) into permeate, tight enough to retain yeast cells (3–6 µm), the bulk of soluble protein, and extracellular polysaccharide (EPS) fragments. Hollow-fiber PVDF is the 2026 default chemistry because of its 1–11 pH tolerance — needed for acidic MSGW influent and alkaline CIP — its 300 ppm feed turbidity tolerance, and its dry-storage capability, which lets modules ship and sit idle without biocide fills. Engineers cross-checking against food-industry UF duty will recognize the same envelope from UF on food-processing wastewater with high organic load and UF on vegetable processing wastewater — the fouling mechanism (protein + EPS) is shared.
The USP boundary condition matters when UF permeate is recycled into the crystallizer circuit: USP-grade MSG must assay at 99.0–100.5% (S4, U.S. Pharmacopeia). A 0.03–0.1 µm PVDF membrane does not, on its own, guarantee that assay — it removes the suspended and high-MW soluble fraction that would otherwise contaminate the crystal — but it is the necessary front end. Specify a hydropurewater hollow-fiber PVDF UF system rated to the envelope below as the baseline scope; UF membrane replacement elements should be stocked on a 3–5 year rotation.
| Parameter | 2026 MSGW spec | Why it matters |
|---|---|---|
| Pore size | 0.03–0.1 µm | Retains yeast (3–6 µm) and soluble protein; passes monovalent salts. |
| MWCO | 100–150 kDa | Retains protein/EPS; passes Na+, Cl−, NH4+. |
| Membrane chemistry | PVDF hollow fiber | pH 1–11 tolerance, dry storage, >300 ppm turbidity feed tolerance. |
| Feed pH window | 2–10 operating; pH 1–11 chemistry limit | Covers raw MSGW pH 2.0 and alkaline CIP pH 12 excursions when chemistry is rated to the upper bound. |
| USP boundary (if recycled to crystallizer) | 99.0–100.5% assay per S4 | UF is the necessary front end, not a guarantee on its own. |
Operating Envelope: Flux, TMP, Backwash, and Recovery
Design flux on MSGW runs 50–100 LMH at TMP 0.1–0.3 MPa, with 90–95% system recovery. The 90–95% figure is the realistic operating recovery, not a clean-water number — generic UF datasheets quote clean-water flux and recovery that will not hold on protein-bearing MSGW feed. Backwash runs every 20–30 minutes using permeate, with air scour; backwash volume is 5–10% of permeate, small enough to recycle upstream of the activated sludge basin without upsetting hydraulic residence time.
Membrane replacement on MSGW duty runs 3–5 years with disciplined CIP — the limiting failure mode is irreversible organic fouling from residual protein and EPS rather than mechanical failure, so the cycle is chemistry-driven. Permeate quality targets from the S3 bench work: <500 mg/L COD after biology alone, <100 mg/L COD after coagulation + UF, and turbidity <1 NTU. The post-coagulation+UF envelope is what protects a downstream RO from organic overload on cooling-tower make-up duty. Engineers specifying against a generic datasheet should treat the flux and recovery values as the upper bound of an operating window, not a steady-state design point.
| Parameter | Operating window | Comment |
|---|---|---|
| Design flux | 50–100 LMH | Operating envelope, not clean-water value. |
| TMP | 0.1–0.3 MPa | Sustainable on protein-bearing feed. |
| System recovery | 90–95% | Backwash water limits net recovery to this range. |
| Backwash interval | Every 20–30 min | Permeate backwash with air scour. |
| Backwash volume | 5–10% of permeate | Recycle upstream of AS basin. |
| Permeate COD | <500 mg/L post-bio; <100 mg/L post-coag+UF | Protects downstream RO. |
| Membrane life | 3–5 years | Driven by TMP creep from protein and EPS fouling. |
CIP Chemistry and the Iron-Scale Loop
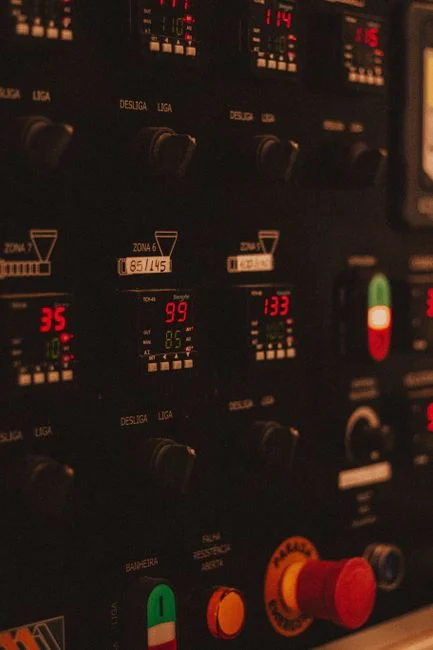
CIP on MSGW runs on a 7–14 day cycle and is dominated by a NaOH wash at pH 11–12, 50–60 °C, for organic and protein removal. The second stage is citric acid at 1–2% (pH 2–3) for iron-scale control — mandatory because of the upstream FeCl3 dose of 1,400 mg Fe/L documented in S3. Skipping the acid stage lets iron scale accumulate on the membrane and drives TMP creep faster than the alkaline wash can recover, which is the most common reason MSGW membranes fail before the 3-year mark.
Backwash water is 5–10% of permeate volume and recycles upstream of biology; only CIP concentrate needs separate handling. Specify a single PLC-controlled CIP and coagulant dosing skid so interlocks and titration logic sit in one place — the iron dose and the citric acid dose are linked through the same influent iron loading, and splitting them across two skids is the most common source of CIP underperformance on this duty. A 2026 OPEX framing for sizing the consumables budget is laid out in the fertilizer wastewater MBR engineering guide for the biology-side chemistry, and the dosing skid delivering CIP and coagulant should match the FeCl3 range from S3.
UF vs MBR vs DAF: The 2026 Procurement Decision
When only one budget line is available, the procurement choice is typically between DAF, MBR, and post-biology UF. DAF is the cheapest and fastest to install but only addresses gross FOG and TSS; it leaves the bulk of soluble COD and produces no recoverable product. MBR integrates biology and membrane in one tank, but the mixed-liquor biology consumes the SCP as substrate for endogenous respiration — there is no protein concentrate to sell. UF after biology is the only configuration that delivers a sellable protein concentrate (the S3 55.8% protein stream concentrated further by membrane) and an RO-quality permeate. The cost is a separate membrane building and a more sophisticated CIP loop.
An MBR reference design, like the hydropurewater MBR unit, can substitute for the UF stage when the plant has no intent to recover SCP, but in 2026 economics the protein-stream recovery case justifies UF on a new MSGW scope. Permeate-side compliance follows the standard envelope covered in the ammonia-nitrogen wastewater treatment systems guide for the NH4+–N residual, and the EU Urban Wastewater Directive 2026 compliance update for the discharge-side envelope.
| Axis | DAF alone | MBR | Post-biology UF |
|---|---|---|---|
| COD removal ceiling | Gross FOG/TSS only | High (biology + membrane) | 40–60% on UF stage alone; > 99% combined with biology |
| Suspended solids | Bulk FOG/TSS | Near-zero in permeate | <1 NTU turbidity in permeate |
| Biomass recovery | None | None (consumed as substrate) | Retentate contains 55.8% protein SCP per S3 — sellable |
| Footprint | Smallest | Compact (one tank) | Larger (separate membrane building) |
| OPEX complexity | Low (polymer + sludge) | Medium (membrane scour + AS control) | Medium-high (CIP chemicals, membrane replacement) |
| Concentrate / by-product value | None | Wasted mixed-liquor | Protein concentrate + RO-quality permeate for reuse |
Procurement Checklist and Sizing Inputs
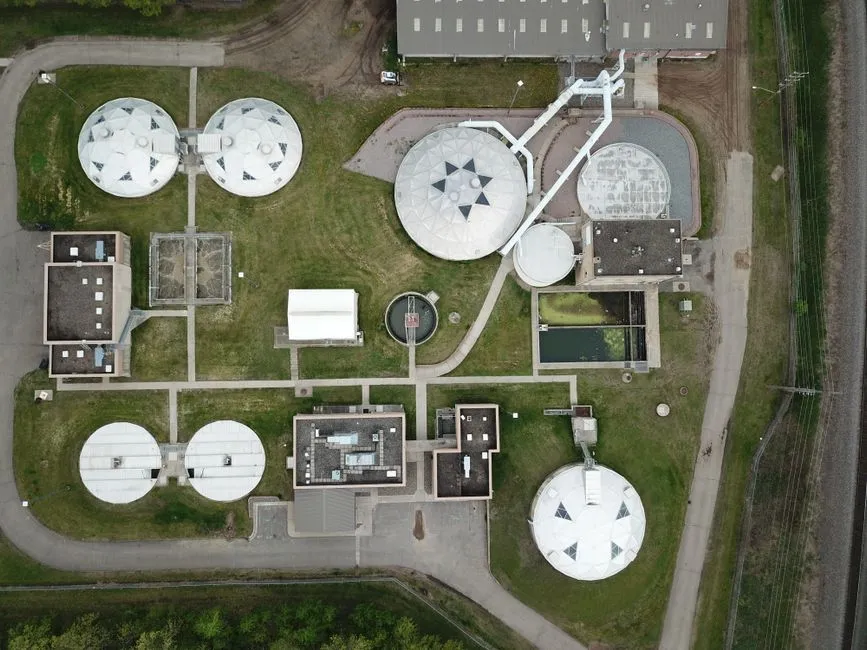
Send the following site-specific numbers with any vendor enquiry, because generic clean-water flux and recovery values will not hold on MSGW: influent flow (m³/h, with peak factor), influent COD, NH4+–N, SO4²−, pH, and temperature, plus the target reuse vs discharge limits. Specify modules rated to 0.03–0.1 µm pore size and 100–150 kDa MWCO on PVDF hollow fiber, and confirm the pH window covers both the raw feed and alkaline CIP. Stock UF membrane replacement elements and RO/UF consumables on a 3–5 year rotation, and pair the UF with an RO polishing stage if permeate is destined for cooling-tower make-up.
Verification is the buyer's responsibility: site-specific design values must be confirmed against current permits, influent testing, and the final equipment proposal. Generic datasheet flux values are clean-water numbers and will not hold on MSGW, and any vendor quoting a UF envelope on clean water alone should be asked to restate against the post-biology feed characteristics from S3 (360–1,300 mg/L COD, ~70 mg/L SS, pH 6–7 after adjustment) and the upstream FeCl3 dose of 1,400 mg Fe/L.
Frequently Asked Questions
What pore size and MWCO should I specify for an MSG wastewater UF?
Specify 0.03–0.1 µm pore size with 100–150 kDa MWCO on a PVDF hollow-fiber module. This window retains yeast cells (3–6 µm) and soluble protein while passing monovalent salts, and matches the operating envelope proven on similar protein-bearing food-processing wastewater and vegetable processing wastewater where the fouling mechanism is the same.
What is the realistic 3-year OPEX frame for an MSGW UF?
The 3-year OPEX is dominated by CIP chemicals — NaOH for the organic wash and citric acid for iron-scale control, the latter being mandatory because of the upstream FeCl3 dose of 1,400 mg Fe/L documented in S3 — plus backwash water at 5–10% of permeate recycled upstream of biology, and a membrane replacement cycle of 3–5 years. The offsetting revenue line is the 55.8% crude-protein retentate from the S3 yeast stage; the site-specific OPEX depends on the actual permeate volume, the local NaOH and citric acid pricing, and the confirmed membrane life, which must be obtained from the vendor against the actual post-biology feed envelope.
Does the UF permeate meet discharge and reuse limits?
Post-biology UF exits at <500 mg/L COD; post-coagulation+UF exits at <100 mg/L COD and turbidity <1 NTU, suitable as RO feed for cooling-tower make-up. Site-specific permit limits, NH4+–N residual, and any local discharge restrictions must still be checked against current permits before commissioning — the values above are the envelope from S3 bench data, not a guaranteed compliance point.
How do I choose between UF and MBR for a new MSGW plant?
UF after biology is the only configuration that delivers a sellable 55.8% protein concentrate (S3) plus an RO-quality permeate. MBR is the substitute only when single-cell protein recovery is out of scope and the plant is sized for discharge-only compliance. For a new 2026 MSGW scope where the protein-stream revenue case holds, UF is the defensible choice; for a discharge-only retrofit with no intent to recover SCP, MBR is a legitimate lower-CAPEX alternative.