Why Fertilizer Plant Wastewater Demands an MBR Solution
A fertilizer wastewater membrane bioreactor solution combines anoxic/aerobic biological treatment with submerged PVDF ultrafiltration (0.1–0.4 μm) to remove 90–98% of COD, 95–99% of ammonia nitrogen, and suspended solids from urea, ammonium nitrate, and NPK plant effluents. MBR systems for fertilizer service typically handle influent COD of 1,000–10,000 mg/L and NH3-N of 200–2,000 mg/L, producing reuse-quality permeate at 50–500 m³/day modular capacity.
Fertilizer manufacturing generates a wastewater profile unlike any other chemical sector. Urea condensates arrive with NH3-N of 800–2,000 mg/L and residual urea of 500–3,000 mg/L. NPK granulation scrubber blowdown carries COD of 2,000–6,000 mg/L, total phosphorus of 100–400 mg/L, FOG of 200–600 mg/L, and suspended solids of 500–2,000 mg/L. Phosphate rock acidulation wastewater drops below pH 2 and carries fluoride of 50–500 mg/L plus total phosphorus of 200–800 mg/L. Conventional activated sludge plants operating at an MLSS ceiling of 4,000–5,000 mg/L cannot retain the slow-growing nitrifying bacteria that high-NH3-N service demands; washout is a near-certainty. MBR systems sustain MLSS at 8,000–12,000 mg/L with 100% solids retention, compressing the biological train to roughly 35–50% of the equivalent ASP footprint (HydropureWater MBR spec, 2026). The membrane barrier is the only practical means of decoupling hydraulic retention from solids retention in this service. Industrial-strength MBR performance in chemically aggressive adjacent streams is documented in the Global NEST Journal, May 2022 (DOI 10.30955/gnj.004278), where the authors reported stable COD and oil removal under high-strength petrochemical loading — a useful precedent for any engineer extrapolating to fertilizer service.
Fertilizer Wastewater Influent Profile by Process Stream
Segmenting waste streams by upstream process is the first engineering step, because blending a pH-1 phosphate acidulation stream with a pH-10 ammonium nitrate neutralizer stream inside the equalization basin wastes neutralization chemical and shocks the biomass. Each fertilizer process line has a characteristic signature, and balancing them upstream determines whether the downstream MBR can stay within its design envelope.
| Process stream | COD (mg/L) | NH3-N (mg/L) | Total P (mg/L) | F⁻ (mg/L) | pH | SS (mg/L) |
|---|---|---|---|---|---|---|
| Urea plant condensate | 500–1,500 | 800–2,000 | <10 | <5 | 7.5–9.5 | 50–200 |
| NPK granulation scrubber blowdown | 2,000–6,000 | 100–400 | 100–400 | 10–60 | 5–9 | 500–2,000 |
| Phosphate rock acidulation | 800–2,500 | 20–80 | 200–800 | 50–500 | <2 | 300–1,200 |
| Ammonium nitrate neutralizer waste | 200–600 | 400–1,200 | <20 | <10 | 6–8 | 100–400 |
| DAP/MAP plant cooler condensate | 1,000–3,000 | 300–900 | 50–200 | 30–150 | 2–5 | 200–800 |
Urea condensates are the cleanest feed and the easiest MBR candidate after flow equalization. NPK scrubber blowdown demands FOG and SS removal upstream because of its high granulator carryover. Phosphate rock acidulation cannot enter the MBR train until limestone or lime pre-neutralization brings pH above 6 and fluoride below 50 mg/L. Ammonium nitrate neutralizer waste is a strong candidate for anoxic denitrification upstream of the MBR because of its high NO3-N of 200–600 mg/L (per HydropureWater field data, 2026).
Process Flow Design: Equalization Through MBR Polishing
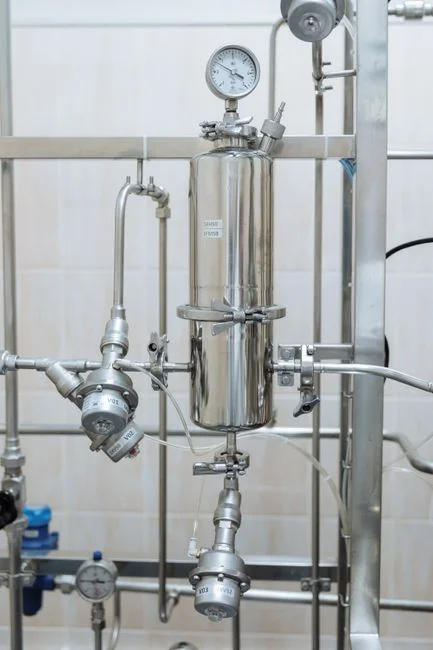
A fertilizer MBR train is a five-stage sequence, and each stage has a defined mass-balance responsibility. Cutting corners upstream simply shifts load to the membrane and shortens service life.
Stage 1 — Equalization and conditioning. A flow equalization basin with 8–24 hours of retention dampens hydraulic and concentration swings between batch urea prills discharges and continuous scrubber blowdown. pH is adjusted to 6.5–8.0 with NaOH or lime dosing, and a plate heat exchanger drops temperature below 35°C to protect the nitrifying biofilm and PVDF membrane. Recirculation mixers keep the basin homogeneous.
Stage 2 — Pretreatment. A dissolved air flotation system or a high-efficiency sedimentation tank strips FOG and settleable solids, targeting SS below 200 mg/L before the biological stage. Skipping this step drives irreversible fouling within weeks in fertilizer service.
Stage 3 — Anoxic/aerobic MBR. The anoxic tank runs 6–10 hours HRT for denitrification of nitrate from the ammonium nitrate line, with methanol or waste COD as carbon source. The aerobic MBR tank follows at 12–24 hours HRT, DO 2–4 mg/L, MLSS 8,000–12,000 mg/L, with submerged flat-sheet modules providing the solid-liquid separation. An integrated MBR wastewater treatment system of this configuration is the workhorse of fertilizer plant MBR installations.
Stage 4 — Polishing. Optional RO or ion-exchange polishing lifts the MBR permeate to boiler-feed or cooling-tower make-up quality, with RO recovery of 70–85% in fertilizer service.
Stage 5 — Sludge handling. Waste activated sludge from the MBR is dewatered on a plate-and-frame filter press producing cake at 22–28% dry solids, suitable for off-site incineration or co-conditioning with raw phosphate rock.
Membrane Selection for High-Ammonia Fertilizer Service
The membrane is the most expensive replaceable component in the train, so geometry and material choices have multi-year OPEX consequences. The right choice depends on which fouling mechanism dominates the specific fertilizer stream — calcium phosphate scaling, FOG blinding, or TSS abrasion.
| Parameter | PVDF flat-sheet (DF series) | PVDF hollow-fiber | Ceramic (Al2O3/TiO2) |
|---|---|---|---|
| Nominal pore size | 0.1 μm | 0.1–0.4 μm | 0.1 μm |
| Module area (m²) | 80–225 | 25–50 | 10–25 |
| Unit capacity (m³/day) | 32–135 | 15–30 | 5–15 |
| Sustainable flux (LMH) | 15–25 | 12–20 | 20–35 |
| MLSS tolerance | 8,000–12,000 mg/L | 6,000–10,000 mg/L | 12,000+ mg/L |
| CIP chemical tolerance | pH 2–12, <2,000 mg/L NaOCl | pH 2–11, <1,000 mg/L NaOCl | pH 0–14, all oxidizers |
| Service life | 3–5 years | 2–3 years | 15+ years |
| Relative CAPEX | 1.0× baseline | 0.7–0.9× | 3–4× |
For most urea and ammonium nitrate service, a DF series PVDF flat-sheet MBR module is the baseline recommendation: it tolerates TSS upsets that would blind a hollow-fiber bundle, cleans in place more easily, and shows 30–40% lower fouling rate at 8,000–12,000 mg/L MLSS in field trials. Hollow-fiber bundles win on packing density and capital cost per square meter, but they are vulnerable to hair/fiber fouling and irreversible calcium phosphate scaling in fertilizer service. Ceramic membranes are reserved for fluoride-rich phosphate rock waste streams where frequent acidic CIP is the norm — the 3–4× CAPEX premium is recovered only when membrane life exceeds ten years. Pore size should stay at 0.1 μm; tighter 0.01–0.04 μm membranes deliver marginal COD gains at 2–3× the trans-membrane pressure. Operating flux of 15–25 LMH is sustainable with a 30-second backwash every 10 minutes and weekly 2–4 g/L NaOCl CIP (per HydropureWater operating data, 2026).
MBR Performance Targets and Compliance Mapping
MBR performance in fertilizer service is well established and reproducible. The following table summarizes achievable effluent against the three principal compliance regimes a 2026 project is likely to face.
| Parameter | MBR effluent (typical) | China GB 8978-1996 Class I | EU BAT-AEL (inorganic chemicals) | US EPA 40 CFR 418 |
|---|---|---|---|---|
| COD (mg/L) | <50 | 100 | 30–50 | — |
| BOD5 (mg/L) | <10 | 30 | 10–15 | 23 (daily max) |
| NH3-N (mg/L) | <5 winter / <10 summer | 15 | 5–10 | — |
| N-total (mg/L) | 10–15 | — | 10–15 | — |
| P-total (mg/L) | 1–2 (with chemical P-precipitation) | 0.5 (Class IA) | 1–2 | — |
| TSS (mg/L) | <10 | 70 | 5–10 | 31 (daily max) |
| pH | 6.5–8.0 | 6–9 | — | 6.0–9.0 |
| F⁻ (mg/L) | <10 (after lime pre-treatment) | 10 | — | 25 (daily max) |
With chemical precipitation for phosphorus, MBR permeate comfortably meets GB 8978-1996 Class I, EU BAT-AEL for the inorganic chemical industry, and US EPA 40 CFR 418 phosphate fertilizer limits. For projects targeting zero liquid discharge, MBR permeate meets FAO irrigation guidelines for most crops and can feed an RO train plus brine evaporator; for a deeper dive into the evaporator economics, see the MVR evaporator operating cost guide for 2026.
CAPEX and OPEX Benchmarks for Fertilizer MBR Projects in 2026
Budget benchmarking in 2026 is dominated by three variables: capacity tier, region of manufacture, and whether RO polishing is included. The table below reflects turnkey CAPEX including civils, equipment, installation, and commissioning, but excluding land and brine-disposal infrastructure (HydropureWater project data, 2026).
| Capacity tier | CAPEX range (USD/m³/day) | OPEX range (USD/m³ treated) | Typical payback vs ASP |
|---|---|---|---|
| 50–200 m³/day | 380–650 | 0.25–0.42 | 3.5–4.5 years |
| 200–500 m³/day | 280–450 | 0.18–0.32 | 2.5–3.5 years |
| 500+ m³/day | 200–320 | 0.15–0.25 | 2.0–3.0 years |
OPEX breaks down as: aeration and pumping 45–55%, membrane replacement every 3–5 years 15–20%, chemical CIP 8–12%, labor 12–18%, sludge disposal 5–10%. At an energy baseline of $0.07–$0.12/kWh, total OPEX lands in the $0.18–$0.42/m³ band depending on capacity and influent strength. The payback against a conventional ASP is driven by 35–50% lower sludge output, a 60% footprint reduction that can be reclaimed for production, and reuse-water revenue — see the 2026 MBR cost and selection reference for the underlying mechanism. China and India fabricators typically run 20–30% below EU and US equivalents on equipment cost; export projects add 8–15% for freight, CE/UL certification, and PLC platform localization. Phosphorus polishing is the most common cost adder — for treatment-train detail, see the 2026 phosphorus removal design reference.
Frequently Asked Questions
Can MBR handle urea-rich fertilizer condensate? Yes. Urea hydrolyzes rapidly in the equalization basin at pH 7–8 and 30–35°C, achieving 95%+ conversion to ammonia before the biological stage. Active urease dosing or thermal hydrolysis accelerates the reaction for condensates above 2,000 mg/L urea.
How often do MBR membranes need replacement in fertilizer service? PVDF flat-sheet modules last 3–5 years with disciplined CIP, while hollow-fiber modules last 2–3 years. CIP runs every 1–2 weeks using 2–4 g/L NaOCl for organic fouling and 1–2% citric acid for inorganic scaling, alternating by month.
Is MBR alone enough for zero liquid discharge? No. MBR permeate is reusable for irrigation and cooling-tower make-up, but a true ZLD design requires downstream RO plus a brine concentrator or evaporator, and a crystallizer for the final solids.
What is the minimum footprint for a 100 m³/day fertilizer MBR? 80–120 m² for the basin and skid package, versus 250+ m² for an equivalent sequencing batch reactor (SBR) at the same load.
Can MBR treat fluoride-rich phosphate fertilizer wastewater? Yes, after lime neutralization to below 50 mg/L F⁻ upstream. If residual fluoride remains above 50 mg/L entering the MBR, ceramic membranes are preferred for their tolerance of acidic fluoride-bearing CIP chemistry.