Why India Data Centres Are Recalculating Cooling-Tower Water Economics in 2026
India added 387 MW of data-centre capacity in 2025 and ranks seventh globally by facility count as of June 2025, with Mumbai, Hyderabad, Delhi-NCR, Bengaluru and Chennai together holding roughly 65% of installed capacity (ET Datacenters, 2026-09). That concentration of megawatts sits inside five of the country's most water-stressed metros, which is why the central government has confirmed it now expects "negligible freshwater consumption" from new data centres — a position explicitly tied to advanced closed-loop cooling and the use of treated wastewater or desalinated water (ET Datacenters, 2026-09). The Visakhapatnam hyperscale cluster being built by Google and Microsoft will be supplied from treated sewage effluent, industrial allocations from the Godavari and Polavaram diversions, and dedicated desalination — confirming the policy direction is operational, not aspirational (ET Datacenters, 2026-09).
For an existing operator still running evaporative cooling on municipal make-up, the implication is uncomfortable: the cost arithmetic that justified a 3–4 cycles-of-concentration baseline in 2022 is being rewritten by regulators, ESG disclosure pressure and municipal tariff revisions in parallel. A typical 5 MW evaporative tower running at 4 cycles in Indian summer conditions withdraws 200–400 m³/day before any blowdown disposal cost is added — and most of that water is potable (Ketos, 2025). The good news is that the same physics that produces that withdrawal also contains the lever that fixes it: blowdown is a recoverable stream, not a waste stream, and every additional cycle of concentration roughly halves the blowdown that needs to leave the site.
What 'Purified Water' Actually Means for a Cooling Tower
For a cooling-tower context, "purified water" means make-up water that has been conditioned — typically by softening, deionisation or reverse-osmosis polishing — to controlled targets for total dissolved solids (TDS), silica, hardness and chloride, rather than raw municipal or borewell supply. It is not the same as ultrapure water used in semiconductor fabs; the goal is chemistry stability at the fill and the heat-transfer surface, not trace ionic purity.
Why this definition matters: roughly 57% of data-centre direct water use globally comes from potable supplies, and one industry assessment puts 80–90% of data-centre water drawn from "blue water" sources such as municipal systems, lakes or aquifers (Ketos, 2025). Purified-water loops directly attack that statistic by lowering withdrawal at the boundary and pushing more of the in-loop volume through recovery. The technical point the buyer should remember: cooling towers do not need drinking-water quality for heat rejection — they need scale, corrosion and microbiological control (Water Today, 2025). A USGBC-aligned LEED-for-data-centres specification already accepts this hierarchy: match water quality to the intended use, substitute non-potable sources wherever technically appropriate.
Two reference points anchor the engineering case. First, closed-loop systems that recirculate aggressively consume only 5–10% of their withdrawal, against roughly 70–80% loss to evaporation in open evaporative systems (Ketos, 2025). Second, the Lawrence Berkeley National Laboratory review found that workload-level water use can vary by more than four orders of magnitude depending on server efficiency, utilisation, cooling architecture and climate — so the technology choice, not the climate, dominates the outcome (Water Today, 2025). For a 2026 India retrofit, that means the design decision is bigger than the weather.
How Blowdown, Cycles of Concentration and Side-Stream Filtration Drive Cost Savings
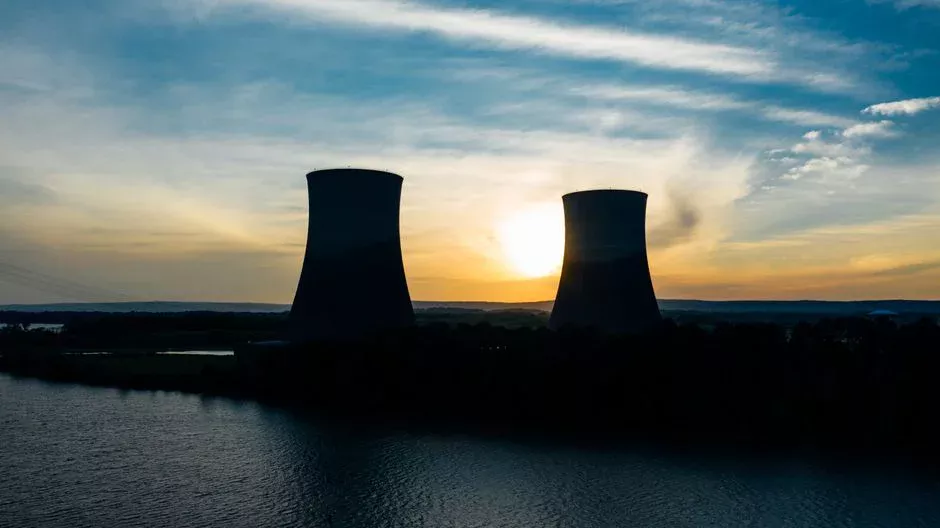
The mass balance is straightforward and worth memorising: blowdown % ≈ evaporation % ÷ (cycles − 1). Doubling cycles of concentration from 4 to 8 roughly halves blowdown volume, because the same dissolved solids have to leave in a smaller liquid stream. In an evaporative cooling tower, 70–80% of withdrawn water is lost to evaporation and only 20–30% leaves as blowdown (Ketos, 2025) — so blowdown is the recoverable stream, not the dominant loss.
Side-stream filtration is the first engineering lever. A side-stream multi-media filter — sand, disc or microsand media — continuously bleeds 5–10% of the circulating water through a polishing step, removing suspended solids before they foul heat-transfer surfaces. That keeps the bulk recirculating water clean enough to operate at 6–8 cycles instead of 3–4, without aggressive chemical intervention. The energy and water benefits of microsand-driven cooling-tower optimisation have been quantified in third-party academic work (SSRN, 2024), which validates the side-stream architecture as a measurable improvement rather than a vendor claim.
Reverse-osmosis polishing of the blowdown stream is the second lever. Because blowdown carries the concentrated dissolved solids that limit cycles, putting an RO polishing train on the blowdown — instead of discharging it — converts the waste stream back into purified make-up. RO simultaneously addresses the parameters that limit cycles: TDS, silica, hardness and chloride. The combined effect: blowdown volume falls roughly 50% at 6 cycles and roughly 75% at 8 cycles against a 4-cycle baseline, and most of the remaining blowdown becomes reusable feed rather than sewer discharge.
There is a secondary benefit the CFO will appreciate. Cooling and environmental control account for about 7% of total electricity in highly efficient hyperscale facilities and more than 30% in less-efficient enterprise data centres (Water Today, 2025). Cleaner heat-transfer surfaces and lower blowdown pumping mean lower compressor and chiller load — so a water-saving retrofit shows up on the power bill as well.
| Parameter | Baseline (potable, 3–4 cycles) | Mid-retrofit (side-stream filtration, 5–6 cycles) | Purified-water loop (SSF + RO, 6–8 cycles) |
|---|---|---|---|
| Make-up water source | Municipal / borewell | Municipal + side-stream polish | RO-polished + blowdown reuse |
| Typical cycles of concentration | 3–4 | 5–6 | 6–8 |
| Blowdown volume vs baseline | 100% | ~65–75% | ~25–50% |
| Target TDS in bulk water | <500–800 mg/L | <400 mg/L | <200 mg/L |
| Target silica (SiO₂) | <150 mg/L | <100 mg/L | <50 mg/L |
| Chemical programme intensity | Acid + scale inhibitor + biocide, weekly blowdown | Reduced acid; inhibitor + biocide only | Minimal acid; inhibitor + oxidising biocide |
| Blowdown destination | 100% sewer / disposal | ~30–50% reuse | ~70–80% reuse |
Cost Savings Breakdown: Baseline vs Purified-Water Loop (India 2026)
Translating the mass balance into rupees is the part procurement and finance actually need. A directional India 2026 view for a 5 MW tower looks like this:
| Cost line | Baseline (potable, 4 cycles) | Purified-water loop (6–8 cycles, RO + SSF) | Notes |
|---|---|---|---|
| Make-up water | ₹80–120/m³ (municipal + extraction surcharge in stressed metros) | ₹40–70/m³ effective (reduced volume, blended cost of RO feed + reuse) | Tariff band depends on metro; Mumbai/Chennai at the upper end |
| Chemical dosing | ₹25–40/m³ of make-up (acid + scale inhibitor + biocide) | ₹8–15/m³ (inhibitor + biocide only) | Acid feed largely eliminated at 6+ cycles with RO feed |
| Blowdown disposal | ₹15–30/m³ of blowdown (sewer/discharge) | ₹3–8/m³ (only the reject fraction leaves site) | ~75% reduction in blowdown volume at 8 cycles |
| Annual water + chemical OPEX (250 m³/day baseline) | ₹1.0–1.6 crore/yr | ₹0.45–0.85 crore/yr | 40–55% reduction is the typical India retrofit band |
| CAPEX (SSF + RO + dosing skid) | — | ₹60–110 lakh (scope-dependent) | Civil + integration typically adds 20–30% |
| Payback (OPEX savings only) | — | 14–28 months | Faster in metros with high potable tariff |
Two details the procurement team should press on. First, the 2025–26 Union Budget extended a data-centre investment tax holiday to 2047 (ET Datacenters, 2026-09), which lowers effective CAPEX on a discounted-cash-flow basis and accelerates the payback calculation that goes to the board. Second, the indirect savings line — lower chemical handling, fewer sewer discharge interactions, avoided potable-water extraction surcharges in stressed metros, and reduced scale-related chiller maintenance — is real but is typically captured only in a full OPEX model, not in a vendor quote.
The equipment scope that delivers this arithmetic is a side-stream multi-media filter for cooling-tower make-up paired with an industrial RO polishing train for blowdown reuse. The side-stream filter keeps the bulk loop clean enough to run at 6+ cycles; the RO polishing train takes the blowdown and turns it back into low-TDS make-up. That pairing is the minimum viable scope for most India 5–10 MW retrofits in 2026.
Selecting the Right Treatment Train for an Indian Site
Over-specifying the treatment train is the single most common CAPEX mistake in India retrofits. A cooling tower that needs <500 µS/cm bulk conductivity and <50 ppm silica does not need a semiconductor-grade RO train, and the cost difference is not trivial — moving from a single-pass RO to a double-pass or ultra-pure polish can double membrane area and energy use (Water Today, 2025).
A vendor-neutral decision framework that works for most 2026 India sites:
- Step 1 — Source water audit: pull seasonal TDS, hardness, silica, chloride and iron across at least one wet and one dry month. Borewell sites in Hyderabad and Bengaluru routinely exceed 1,500 mg/L TDS; municipal supply in Chennai swings 200–600 mg/L seasonally.
- Step 2 — Set the target cycles: if the chemistry can hold 6 cycles with inhibitor-only dosing, specify for 6–8 cycles. Target cycles drive blowdown volume, which drives RO sizing.
- Step 3 — Decide on blowdown reuse target: if blowdown reuse ≥ 70% is the goal, RO polishing is mandatory; if 30–50% reuse is acceptable, a softener + side-stream filter may be sufficient.
- Step 4 — Reset the chemical programme: moving to a purified-water loop removes most acid feed; specify a PLC-controlled chemical dosing skid matched to the new bulk chemistry. Pair with an industrial softener upstream of the cooling tower where silica and hardness are the limiting parameters.
On the monitoring side, an effective dashboard pairs WUE with potable-water intensity, non-potable share, withdrawal by source, cooling-tower make-up, blowdown, cycles of concentration and peak-day consumption (Water Today, 2025). Sub-meter individual cooling plants on multi-phase campuses. And align the drought-operations sequence with the electrical sequence of operations — the cooling plant can have redundant pumps and chillers and still fail if the design assumed unlimited water.
2026 ROI Worked Example and Frequently Asked Questions
Worked example — 5 MW Chennai tower, 2026. Baseline withdrawal 250 m³/day at 4 cycles. Combined water + chemical + blowdown disposal cost sits in the ₹1.0–1.6 crore/yr range at Chennai municipal tariffs. A purified-water loop delivering 40% OPEX reduction saves ₹40–65 lakh/yr. Against a CAPEX of ₹60–110 lakh for the side-stream filter, RO polishing train, dosing skid and integration, payback lands at 14–28 months on OPEX alone, before any WUE-based ESG credit or tax-holiday benefit (ET Datacenters, 2026-09). The WUE lever matters because it converts a facilities saving into a reportable metric: a move from 1.8 L/kWh toward 1.0–1.3 L/kWh is defensible to a sustainability committee and is directly aligned with India's 2026 policy direction toward negligible freshwater use in new data centres.
The integrated UF pretreatment skid ahead of the RO membranes, paired with RO and UF membrane replacements sized for higher TDS feed, is the typical 2026 turnkey scope for an Indian hyperscale or colocation site. Operators looking for a broader regional view of blowdown handling can compare against the data-centre cooling blowdown treatment guide for Abu Dhabi, or the data-centre wastewater and cooling-blowdown treatment in the Middle East reference for adjacent water-stress conditions. Sites co-located with fabs should also reference the UPW contamination budget for adjacent fabs to make sure the cooling-tower water programme does not bleed into a more stringent fab UPW spec.
What is a realistic 2026 payback for a purified-water cooling-tower retrofit in India?
For a 5–10 MW evaporative tower, payback on water + chemical OPEX savings alone typically lands at 14–28 months, with the faster end of the band in metros where municipal potable tariffs are highest (Mumbai, Chennai, Hyderabad). Adding the 2025–26 Union Budget tax holiday for data-centre investors and any WUE-based ESG credit shortens the financial payback further (ET Datacenters, 2026-09).
How much of a typical India data-centre cooling-tower blowdown can actually be reused?
At 6 cycles of concentration, blowdown volume falls by roughly 50% versus a 4-cycle baseline; at 8 cycles, the reduction is roughly 75%. In mass-balance terms, blowdown % ≈ evaporation % ÷ (cycles − 1), so each additional cycle reduces the liquid stream that has to leave the site. The 20–30% of withdrawal that leaves as blowdown in open evaporative systems is the recoverable fraction; the other 70–80% is lost to evaporation and cannot be captured at the tower (Ketos, 2025).
Does an India operator actually need RO, or is side-stream filtration enough?
It depends on source water. For borewell or high-TDS sites (>1,000 mg/L), put RO before the tower — side-stream filtration alone will not bring silica and chloride under control at 6+ cycles. For municipal supply with seasonal variation in the 200–600 mg/L range, a side-stream filter plus softener often delivers 5–6 cycles and 30–50% blowdown reuse without RO. If the goal is 70–80% blowdown reuse and 6–8 cycles, RO polishing becomes mandatory (Water Today, 2025; Ketos, 2025).
Why is water economics suddenly a board-level topic for India data centres in 2026?
India added 387 MW of data-centre capacity in 2025, with the five metros of Mumbai, Hyderabad, Delhi-NCR, Bengaluru and Chennai holding about 65% of installed capacity (ET Datacenters, 2026-09). The central government has stated it expects negligible freshwater consumption from new data centres, and the Visakhapatnam hyperscale cluster will be supplied from treated wastewater, Godavari/Polavaram industrial allocations and desalination. For a board evaluating a 2026 CAPEX proposal, that policy direction turns a facilities-level water decision into a regulatory-defensibility decision.
Frequently Asked Questions
How much can an India data centre actually save by reusing purified water in cooling towers in 2026?
In 2026, Indian data centres utilizing advanced water treatment and recycling can reduce raw water procurement costs by 40% to 60% annually. With municipal water tariffs rising and the cost of tanker-supplied water in regions like NCR and Bengaluru often exceeding ₹150 per kilolitre, a 5 MW facility can achieve annual operational savings between ₹1.2 crore and ₹2.5 crore depending on the local water stress index and recycling efficiency.
What cycles of concentration should an India cooling tower run at to minimise blowdown?
To minimize blowdown and water waste, Indian data centre cooling towers should operate at Cycles of Concentration (COC) between 6.0 and 8.0. Operating at these levels, supported by high-performance antiscalants and side-stream filtration, reduces blowdown volume by approximately 30% compared to standard operations at 3.0 to 4.0 COC, directly extending the life of the water treatment media and reducing chemical consumption.
Is RO polishing of cooling-tower blowdown worth the CAPEX for a 5 MW India site?
For a 5 MW facility, Reverse Osmosis (RO) polishing of blowdown typically yields a Return on Investment (ROI) within 18 to 24 months. Given the increasing stringency of Zero Liquid Discharge (ZLD) mandates in Indian industrial clusters, the CAPEX for an RO plant is offset by the elimination of wastewater discharge penalties and the reduction in raw water makeup requirements, which can save up to 85% of the water previously lost to blowdown.
Does the Indian government now require data centres to use non-freshwater for cooling?
Yes, the Ministry of Electronics and Information Technology (MeitY) and various State Pollution Control Boards have introduced guidelines strongly incentivizing or mandating the use of treated sewage effluent (TSE) or recycled water for non-potable cooling purposes. In water-stressed regions, local municipal corporations are increasingly denying new grid connections unless the facility commits to utilizing 100% recycled water for cooling tower makeup.
How is cooling-tower WUE measured and what is a realistic 2026 target in India?
Water Usage Effectiveness (WUE) is measured as the ratio of annual site water usage (litres) to the annual IT equipment energy usage (kWh). In the Indian climate, a realistic and industry-leading WUE target for 2026 is 0.20 L/kWh or lower for air-cooled systems with evaporative assistance, provided the facility employs closed-loop monitoring and high-efficiency water recovery systems to mitigate the high evaporation rates caused by ambient heat.