TMDL-Driven Phosphorus Limits: What US Utilities Face in 2026
US utilities facing TMDL-driven phosphorus limits of 0.01–0.1 mg/L TP achieve compliance primarily through chemical addition (alum or ferric) combined with tertiary filtration — EPA Region 10 documented 23 plants reaching 0.007–0.2 mg/L TP using this approach. For limits ≤0.05 mg/L, two-stage filtration or ballasted sedimentation (CoMag) is typically required; for 0.05–0.1 mg/L, single-stage tertiary filtration with optimized chemical dosing often suffices. Technology selection hinges on permit tier, existing secondary process, and site footprint.
Total Maximum Daily Load (TMDL) waste load allocations translate into NPDES permit limits for total phosphorus that typically range 0.009–0.1 mg/L across sensitive basins (EPA Region 10, April 2007). For technology-screening purposes, three practical permit tiers structure the decision: Tier 1 (0.01–0.03 mg/L TP) demands two-stage filtration, ballasted sedimentation, or membrane-based polishing; Tier 2 (0.03–0.05 mg/L TP) can be met with single-stage filtration plus multi-point chemical dosing or MBR with chemical addition; Tier 3 (0.05–0.1 mg/L TP) typically requires only single-stage filtration with optimized coagulant dosing on a BNR or conventional activated-sludge basis.
EPA's NPDES framework under Clean Water Act §402 and 40 CFR §122.1(b) regulates municipal WWTPs as point sources, with phosphorus limits expressed as monthly average, weekly average, and daily maximum values on the Discharge Monitoring Report (DMR). Most TMDL-driven permits include 3–5 year compliance schedules, and utilities in the Chesapeake Bay, Great Lakes, and Pacific Northwest basins are in active upgrade cycles. Plants in the EPA Region 10 survey operated at permit limits from 0.05 mg/L (Pinery, CO) up to 0.5 mg/L daily maximum (Breckenridge, CO), but achieved actual effluents of 0.007–0.2 mg/L through advanced treatment — proof that the 0.01–0.1 mg/L envelope is technically achievable at full scale (source: EPA 910-R-07-002, 2007).
Core Technology Trains for Phosphorus Removal: Mechanisms and Proven Performance
Six technology trains dominate municipal phosphorus removal in 2026, each with a distinct removal mechanism, documented performance envelope, and operational footprint. The EPA Region 10 evaluation (2007) provides the strongest full-scale performance dataset for utility engineers to anchor their selection.
Chemical precipitation plus single-stage tertiary filtration uses aluminum- or iron-based coagulants at 10–50 mg/L dose followed by multi-media or cloth-media filters. Full-scale plants in this category achieved 0.05–0.15 mg/L TP — Clean Water Services' Rock Creek and Durham plants in Oregon averaged 0.07 mg/L TP under monthly-median permit limits of 0.1 and 0.11 mg/L respectively (EPA 910-R-07-002, 2007). This is the lowest-complexity train and suits Tier 3 permits.
Chemical precipitation plus two-stage filtration adds a second filtration stage (typically Dynasand upflow filters) with inter-stage coagulant re-dosing. Farmers Korner WWTP in Colorado achieved 0.007 mg/L average TP; Walton and Stamford (both New York) achieved 0.01 mg/L and 0.011 mg/L respectively, with monthly-average ranges as low as 0.002–0.06 mg/L (EPA 910-R-07-002, 2007). Two-stage filtration is the workhorse for Tier 1 permits where chemical dose alone cannot reliably reach sub-0.03 mg/L TP.
Ballasted sedimentation (CoMag) combines chemical coagulation with magnetite ballast addition and high-rate sedimentation, followed by magnetic polishing. The Concord WWTP pilot in Massachusetts achieved 0.04 mg/L average TP — sufficient for Tier 2 — with footprint reductions of 50–75% versus conventional clarification due to surface loading rates above 40 m/h (EPA 910-R-07-002, 2007).
Iron-coated sand filtration (BluePro) uses adsorption plus filtration in a Centra-Flo configuration. The Hayden WWTP pilot in Idaho achieved 0.013 mg/L average TP, placing it in Tier 1 territory. Performance depends on influent orthophosphate speciation and sand media replacement intervals (EPA 910-R-07-002, 2007).
Membrane bioreactor (MBR) with chemical addition couples submerged PVDF membranes (0.03–0.1 μm nominal pore) with biological phosphorus removal and pre- or in-tank coagulant dosing. The LOTT Budd Inlet WWTP in Washington achieved 0.058 mg/L average TP using an oxidation ditch followed by chemical addition and membrane filtration, with monthly averages ranging 0.036–0.092 mg/L (EPA 910-R-07-002, 2007). An integrated MBR system with chemical phosphorus removal typically delivers a 60% smaller footprint than an equivalent conventional activated-sludge plus tertiary filtration train, making it attractive for space-constrained retrofits.
High-rate clarification plus filtration uses lamella-plate settlers operating at 20–40 m/h surface loading rates, often paired with flocculation and a tertiary filter polish. A lamella clarifier for tertiary phosphorus removal reduces coagulant consumption by approximately 30% compared to conventional clarification because the inclined plates enhance floc-blanket contact and improve orthophosphate precipitation kinetics (HydropureWater lamella data, 2026). A PLC-controlled multi-point coagulant dosing system is the typical pairing for any of the above trains, allowing primary, secondary, and tertiary dose points to be tuned independently.
| Technology Train | Mechanism | Achievable TP (mg/L) | EPA Region 10 Reference Plant | Reported Avg TP |
|---|---|---|---|---|
| Chemical + single-stage filtration | Coagulation + media filtration | 0.05–0.15 | Rock Creek, OR; Durham, OR | 0.07 mg/L (both) |
| Chemical + two-stage filtration | Sequential precipitation + filtration | 0.007–0.03 | Farmers Korner, CO; Walton, NY; Stamford, NY | 0.007 / 0.01 / 0.011 mg/L |
| Ballasted sedimentation (CoMag) | Magnetite ballast + magnetic polishing | 0.04 (pilot) | Concord, MA | 0.04 mg/L |
| Iron-coated sand (BluePro) | Adsorption + filtration | 0.013 (pilot) | Hayden, ID | 0.013 mg/L |
| MBR + chemical addition | Biological P + membrane + coagulant | <0.05 | LOTT Budd Inlet, WA | 0.058 mg/L |
| High-rate clarification + filtration | Lamella settling + media filtration | 0.03–0.08 | HydropureWater pilot data | ~30% lower chemical use vs. conventional |
Technology Comparison Matrix: Performance, Footprint, and Cost Drivers by Permit Tier
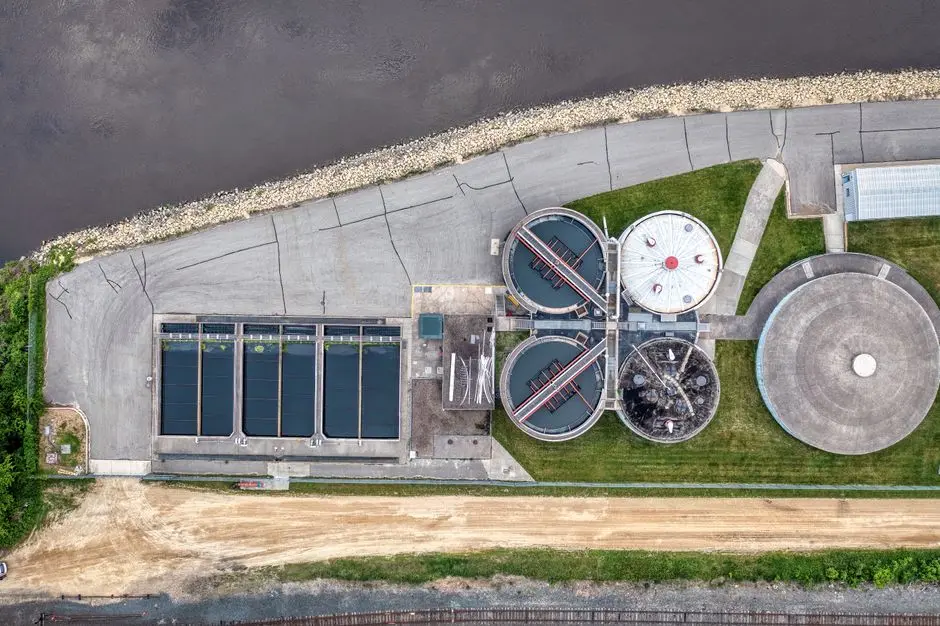
Mapping each technology train to a permit tier allows rapid screening. The matrix below distills coagulant dose, sludge yield, footprint, and retrofit complexity for each train at its target tier. All values are drawn from EPA Region 10 full-scale data (2007) and HydropureWater engineering references.
| Technology Train | Target Permit Tier | Achievable TP (mg/L) | Coagulant Dose (mg/L as Al/Fe) | Sludge Yield Increase | Footprint vs. Secondary | Retrofit Complexity | Key OPEX Driver |
|---|---|---|---|---|---|---|---|
| Chemical + two-stage filtration | Tier 1 (≤0.03) | 0.007–0.03 | 30–80 | +25–40% | 1.5–2.0× | High | Alum/ferric chemical, dual filter backwash |
| Ballasted sedimentation (CoMag) | Tier 1–2 | 0.04 (pilot) | 20–40 | +15–25% | 0.4–0.6× | High | Magnetite makeup, polymer |
| Iron-coated sand (BluePro) | Tier 1 | 0.013 (pilot) | 15–30 | +15–20% | 0.7–1.0× | Moderate–High | Sand media replacement |
| MBR + chemical | Tier 2 (0.03–0.05) | <0.05 | 15–35 | +10–20% | 0.4× (smaller) | Moderate | Membrane replacement, aeration energy |
| Single-stage filtration + multi-point dosing | Tier 2–3 | 0.03–0.10 | 20–50 | +15–25% | 1.2–1.5× | Moderate | Coagulant, filter backwash |
| Single-stage filtration + optimized dosing | Tier 3 (0.05–0.1) | 0.05–0.15 | 10–30 | +10–15% | 1.1–1.3× | Low | Coagulant |
Chemical cost sensitivity is significant at low TP targets. At a 0.01 mg/L target, an alum dose of approximately 60 mg/L translates to roughly $0.12 per 1,000 gallons treated at 2026 bulk alum pricing of ~$350/ton; ferric chloride at 50 mg/L Fe runs approximately $0.18 per 1,000 gallons. A 10 mg/L alum dose adds roughly 8–12 kg of dry solids per million liters treated, which directly impacts downstream dewatering capacity — sizing a plate-frame filter press for the higher cake load is non-negotiable in Tier 1 designs (HydropureWater engineering reference, 2026).
Selection Framework: Matching Technology to Your Plant Constraints
Use this four-step process to move from permit stringency to a defensible technology recommendation.
Step 1 — Confirm the permit tier and compliance schedule. Tier 1 (≤0.03 mg/L TP) typically requires a 3–6 month pilot per EPA Region 10 guidance; Tier 2/3 can often proceed on bench-scale jar testing plus calibrated process modeling. Identify the monthly-average limit, the daily maximum, and the wet-weather provisions — peak flow management is as much a driver as base-load performance.
Step 2 — Assess the existing secondary process. A BNR plant (A²/O, modified Bardenpho, or oxidation ditch with biological P removal) typically has 0.5–1.5 mg/L TP leaving secondary clarification and only needs a tertiary polish. A conventional activated-sludge plant without biological P removal carries 3–6 mg/L TP into tertiary and needs a full chemical-plus-filtration train. For plants already configured for biological P removal, an A²/O upgrade with tertiary phosphorus removal case study is the most relevant reference.
Step 3 — Evaluate the site footprint. If less than 50% of the area required for conventional tertiary filtration is available, MBR or ballasted sedimentation becomes the primary option because they replace — rather than add to — the secondary clarification step. MBR footprint is typically 40% of an equivalent conventional train (HydropureWater MBR specs, 2026).
Step 4 — Run a 20-year lifecycle cost comparison. Include chemical cost per kg P removed, sludge dewatering and disposal (see the polymer dosing for chemical phosphorus sludge dewatering reference), power for aeration and pumping, membrane replacement for MBR, and operator labor. The decision rule is straightforward: if existing secondary clarifiers have hydraulic capacity, add tertiary filtration plus optimized dosing — lowest CapEx. If clarifiers are at hydraulic capacity, MBR or ballasted sedimentation avoids new clarifier construction. Plants converting from lagoon systems can follow the lagoon-to-MBR upgrade guide for phosphorus limits for a worked example.
Operational Excellence: Chemical Dosing Control, Monitoring, and Compliance Assurance
Hitting sub-0.05 mg/L TP reliably depends on three operational practices: multi-point dosing, real-time monitoring, and disciplined backwash handling. A multi-point strategy that places coagulant at the primary clarifier influent, the aeration tank, and the tertiary filter influent reduces total dose 15–25% compared to single-point application (HydropureWater field data, 2026), because each dose point precipitates a different phosphorus fraction (particulate, colloidal, dissolved).
Online orthophosphate analyzers (Hach, WTW, or equivalent) at 15-minute intervals enable feed-forward dosing control tied to influent TP load — essential for Tier 1 and Tier 2 permits where diurnal swings otherwise force conservative over-dosing. pH control is equally critical: alum coagulation is optimal at pH 6.0–7.0 and ferric at pH 5.0–6.5; an automatic pH trim system prevents dose waste caused by alkalinity-driven pH drift.
Filter backwash water carries 5–20 mg/L TP and must be returned to the headworks — not discharged — or it will cycle the removed phosphorus back through the plant. Design an equalization basin sized to absorb the slug load (typically 2–4% of daily flow) so the secondary process sees a steady phosphorus load rather than a daily pulse. For DMR compliance, target operation at less than 80% of the monthly-average permit limit to absorb analytical and hydraulic variability without excursion.
Frequently Asked Questions
What is the most cost-effective technology for a 0.05 mg/L TP limit?
Single-stage tertiary filtration with multi-point alum dosing. The Pinery WWRF in Colorado and Alexandria Sanitation Authority in Virginia both achieved 0.029–0.088 mg/L TP with this configuration at full scale, at the lowest CapEx of any train when existing secondary clarifiers have hydraulic capacity (EPA 910-R-07-002, 2007).
Can MBR alone meet 0.01 mg/L TP without chemicals?
No. Submerged PVDF membranes at 0.03–0.1 μm reject particulate and colloidal phosphorus but do not remove dissolved orthophosphate, which typically constitutes 50–70% of secondary effluent TP. Chemical addition or enhanced biological phosphorus removal is required to reach sub-0.05 mg/L TP reliably.
How much does chemical phosphorus removal increase sludge disposal costs?
Expect 15–40% more dry solids depending on coagulant dose. At 50 mg/L alum, chemical sludge adds approximately $0.03–0.05 per 1,000 gallons treated in additional dewatering and disposal cost — enough to require verification that the existing plate-frame filter press or centrifuge has adequate capacity, or that a DAF system for chemical sludge thickening is included in the upgrade scope.
Is pilot testing required by regulators for new phosphorus limits?
Most state agencies require a 3–6 month pilot for limits at or below 0.05 mg/L TP. For 0.05–0.1 mg/L limits, a calibrated process model supported by jar testing is often accepted — though EPA Region 10's 2007 evaluation still recommends site-specific confirmation given the variability in influent P speciation and coagulant demand.
What happens if we exceed the TP limit during wet weather?
Peak wet-weather flows are the single largest cause of TP excursions. Equalization basins sized for 2–4 hours of peak flow, or high-rate ballasted sedimentation that maintains removal at surface loadings above 40 m/h, are the two most effective mitigation strategies. Both keep coagulant contact time within design range even when hydraulic residence time in the secondary system drops by 50% or more.