Why Harrisonburg-Area Food and Beverage Plants Are Under Pretreatment Pressure in 2026
Food and beverage plants in the Shenandoah Valley navigate three overlapping rule layers before a single gallon reaches the James or the Shenandoah River watershed. Federal categorical pretreatment standards under 40 CFR Part 403 establish the discharge floor for food processing; Virginia DEQ (Department of Environmental Quality) enforces state-level industrial wastewater requirements; and the Harrisonburg-Rockingham Sewer Authority (HRSA) imposes site-specific BOD, TSS, FOG, and pH caps that are typically stricter than either (per 40 CFR Part 403 and the 2026 HRSA industrial discharge guidance, 2026-01).
When a plant misses those limits, the consequences cascade predictably: sewer surcharges, escalated self-monitoring, a Notice of Violation, mandatory pretreatment installation orders, and ultimately permit revocation or production shutdown (per Crystal Clean, S2, 2025-11). The financial exposure in 2026 runs into six figures for a mid-size dairy before any capital improvement is even specified.
Rockingham County is the top-ranked U.S. county for dairy production, and the I-81 corridor concentrates poultry processing, frozen-vegetable, and confectionery operations. The Route 11 corridor has added a dense cluster of craft breweries. Each sub-sector pushes a different load profile, but they all share a common design failure mode: average-flow treatment trains collapse during the 2–4× peak surges that hit during washdowns and CIP (clean-in-place) sanitation shifts (per Crystal Clean, S2). A system sized for averages fails at the moments that matter, and those are the moments the sampling crew is watching.
The Four Wastewater Challenges Harrisonburg Plants Actually Have to Treat
Valley plants produce four distinct wastewater phenotypes, and a generic "food and beverage" spec misses every one of them. Dairy generates BOD 10–20× higher than domestic sewage, with protein-rich streams that foam, plus acid whey and caustic CIP chemistry that swing pH across a 4–11 range within a single shift (per Crystal Clean, S2). Poultry and meat produce very high FOG, blood, and suspended solids; the FOG load risks pipe clogging and biological-treatment upset if it reaches the aeration basin uncontrolled (per ALAR, S4).
Breweries and beverage operations push high concentrations of sugars and starches that drive rapid BOD exertion. The Bear Republic installation demonstrated that a well-designed anaerobic stage with combined heat and power (CHP) can offset roughly 50% of facility electricity and 25% of hot-water demand from biogas recovered on-site (per IWS, S5). Vegetable wash, frozen food, and confectionery lines generate high TSS (pulp, seeds, grain fines) with sharp seasonal loading spikes and a documented H₂S (hydrogen sulfide) odor risk that has to be managed at the headworks, not downstream (per USP Technologies, S3).
Across all four sub-sectors, CIP chemistry is the cross-cutting challenge. Caustic cleaners and acid sanitizers cycle through the drain on a sanitation schedule, and a sewer system pH band of 6.0–9.0 does not tolerate a plant discharging pH 11 at 2 a.m. and pH 3 at 6 a.m. without equalization or active neutralization (per Crystal Clean, S2).
The 2026 Pretreatment Process Train That Passes Local Discharge Limits
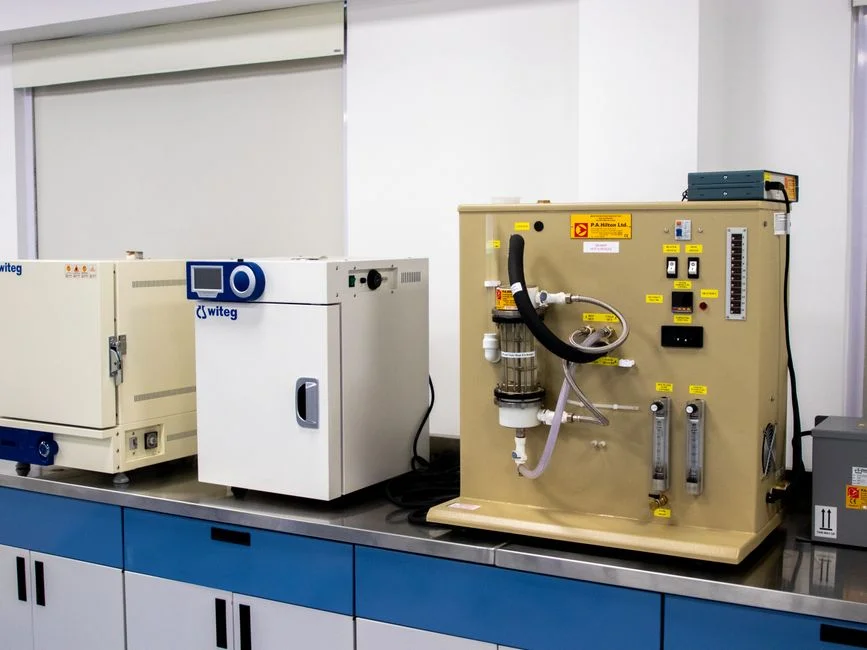
A defensible train for a 50–500 m³/day Harrisonburg-area plant runs seven named unit operations. Each is specified against a job it actually does, and the sizing logic flows from peak flow, not average flow.
- Rotary bar screening. A rotary bar screen (GX-type) protects downstream pumps, DAF, and any membrane from rags, packaging fragments, and large solids before the stream enters the equalization basin.
- Flow and pH equalization. Basin sized for 2–4× average daily flow so the peak surge from a CIP cycle blends with off-peak production flow rather than slug-loading the downstream train (per Crystal Clean, S2). Aeration mixing in the EQ (equalization) basin also strips CO₂-driven pH transients.
- Dissolved air flotation (DAF). The FOG and TSS workhorse. Industrial food-grade DAF system for FOG and suspended solids units in the 4–300 m³/h range deliver 85–95% TSS and FOG removal when correctly dosed with coagulant and flocculant (per HydropureWater DAF field data, 2026).
- Biological treatment — MBBR or MBR. A Moving Bed Biofilm Reactor (MBBR) handles load swings without sludge recycle, suiting dairy and meat operations with shifting schedules. An integrated MBR system pairs biological treatment with submerged membranes (pore size <1 μm) and delivers consistent sub-30 mg/L BOD₅ effluent in roughly 60% of the footprint of a conventional activated-sludge basin (per HydropureWater MBR field data, 2026). Choice depends on space, reuse intent, and discharge limits.
- pH trim and chemical polishing. An automatic chemical dosing skid injects coagulant, flocculant, acid, or caustic on a PID (proportional-integral-derivative) loop from a pH probe downstream of the biological stage, locking effluent inside the POTW pH band of 6.0–9.0.
- Disinfection. A UV disinfection stage at 254 nm provides chemical-free inactivation before the final sampling point, with chlorine dioxide as a backup where the local authority prefers a residual.
- Sludge handling. DAF float and biological waste sludge are dewatered on a plate-and-frame filter press to 18–25% dry solids, cutting hauling volume and disposal cost per cubic yard (per HydropureWater press data, 2026).
For breweries with very high COD (often >10,000 mg/L) and a continuous discharge profile, an upstream anaerobic stage with biogas-to-CHP can replace or precede step 4. The Bear Republic installation recovered roughly 50% of facility electricity and 25% of hot-water demand from on-site biogas (per IWS, S5). For more on aeration sizing for high-strength beverage waste, see the beverage wastewater aeration system design guide.
Typical 2026 Influent vs. Effluent Numbers for Each Stage
The numbers below are the operating envelope a Harrisonburg-area plant should benchmark against before issuing an RFQ (request for quotation). They reflect typical food and beverage values reported across the cited sources, not site-specific guarantees.
| Parameter | Raw influent | After screening & equalization | After DAF | After MBBR / MBR | Typical POTW limit |
|---|---|---|---|---|---|
| BOD₅ (mg/L) | 1,500–10,000 | 1,200–8,000 | 900–6,500 | <30 (MBR); 30–60 (MBBR) | 250–500 |
| COD (mg/L) | 3,000–20,000 | 2,500–16,000 | 2,000–12,000 | <100 (MBR); 100–250 (MBBR) | — |
| TSS (mg/L) | 500–4,000 | 450–3,500 | 50–300 | <10 (MBR); 20–50 (MBBR) | 200–400 |
| FOG (mg/L) | 200–3,000 | 200–2,500 | 20–150 | <20 | 50–100 |
| pH | 3–11 (swinging) | 5–9 (moderated) | 6–8 | 7–8 | 6.0–9.0 |
DAF routinely achieves 85–95% removal of both TSS and FOG when coagulant/flocculant chemistry is matched to the stream; MBBR/MBR stages then push BOD removal above 90% to land final effluent at BOD₅ <30 mg/L and TSS <10 mg/L (per ALAR, S4 and HydropureWater product performance data, 2026). When TSS starts creeping back above target, walk the recovery path in the TSS exceedance troubleshooting guide. The pH column is the one to watch during CIP surges: equalization buys time, active neutralization closes the band, and the sewer authority's 6.0–9.0 envelope is non-negotiable (per Crystal Clean, S2).
Comparing the Three Biological Treatment Options for a Mid-Size Valley Plant
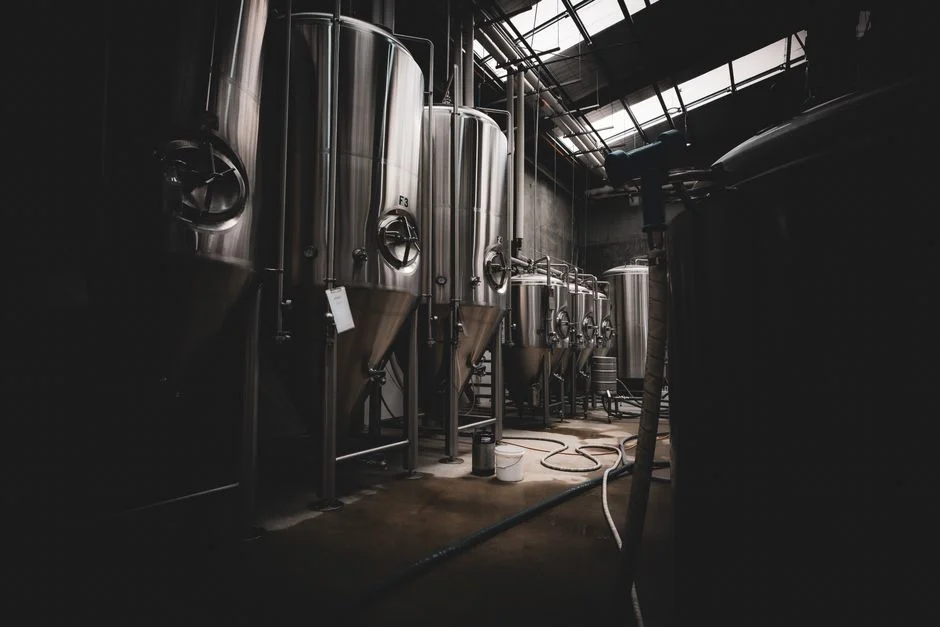
For a procurement manager choosing between activated sludge, MBBR, and MBR at 50–500 m³/day, the decision is footprint, reuse intent, and how badly the plant's load swings between shifts.
| Option | Typical footprint | Effluent BOD₅ | Load-spike tolerance | Reuse-ready? | Relative CAPEX (capital expenditure) |
|---|---|---|---|---|---|
| Conventional activated sludge | Largest (1.0× baseline) | 20–40 mg/L | Low; sensitive to shock loads | No (clarifier carryover) | Lowest |
| MBBR | Medium (0.6–0.7×) | 30–60 mg/L | High; biofilm tolerates swings | Partial (with downstream filtration) | Mid |
| MBR (membrane bioreactor) | Smallest (~0.4×, ~60% smaller than conventional) | <10–30 mg/L | High; membranes act as absolute barrier | Yes (<1 μm filtrate) | Highest |
| Anaerobic + CHP | Adds reactor; eliminates most aeration energy | Polishing required downstream | Very high; methane buffer | Polishing stage needed | High; offset by energy revenue |
Conventional activated sludge is the lowest CAPEX but the riskiest match for F&B plants with peak-shift flows. MBBR is the practical middle ground for dairy and meat operations where the swing is the dominant design constraint. MBR is the right pick when local water scarcity or a reuse credit applies, since the <1 μm effluent can feed CIP rinse, boiler makeup, or landscape irrigation after UV (per HydropureWater MBR data, 2026). Anaerobic plus CHP, as the Bear Republic example shows, is a fourth path where biogas offsets roughly 50% of electricity and 25% of hot water demand (per IWS, S5).
2026 Cost Framing: What Harrisonburg Plants Should Budget
Budget ranges for 2026, segmented by average daily flow, based on packaged equipment quotes across the cited sources and HydropureWater field data:
- Small (<50 m³/day): $150,000–$400,000 CAPEX for a packaged DAF-led or MBR system, plus $8,000–$20,000/month OPEX (operating expenditure) for chemicals, hauling, and energy.
- Mid (50–500 m³/day): $500,000–$1,800,000 CAPEX for a full train (screen + EQ + DAF + MBBR/MBR + UV + press), with OPEX of $15,000–$60,000/month.
- Large (>500 m³/day): $2,000,000–$6,000,000+ CAPEX, often with anaerobic front-end; OPEX dominated by aeration energy and sludge hauling.
OPEX drivers to track: coagulant and flocculant consumption, caustic/acid for pH trim, sludge-haul cost per cubic yard (a plate-and-frame press cuts this materially), aeration energy, and—often the biggest swing factor—POTW surcharges when monthly BOD or TSS averages slip above the cap (per ALAR, S4). The hidden cost to model is off-site hauling of untreated high-strength waste to a permitted facility, which becomes uneconomic above roughly 50 m³/day; on-site pretreatment typically wins on a 3–5 year ROI (return on investment) at that scale (per ALAR, S4). For a parallel regional cost profile, the Tillamook F&B pretreatment guide walks through a similar CAPEX/OPEX breakdown.
Frequently Asked Questions
What BOD limit does HRSA typically enforce?
HRSA's site-specific industrial discharge permit typically caps BOD₅ in the 250–500 mg/L range, with TSS and FOG caps in the 200–400 mg/L and 50–100 mg/L range respectively, all stricter than the federal floor set by 40 CFR Part 403 categorical pretreatment standards. The exact cap is permit-specific and renegotiated when flow or product mix changes, so confirm the current number with HRSA before final equipment sizing (per 40 CFR Part 403 and the 2026 HRSA industrial discharge guidance, 2026-01).
Do I need a DAF if I already have an MBR?
Yes, in most food and beverage cases. DAF sits upstream of the biological stage as a FOG and TSS protection step; an MBR is designed to polish biology, not to handle raw FOG. Skipping DAF risks membrane fouling, lost aeration tank volume to floatable scum, and CIP chemistry carrying FOG straight into the membrane tank. DAF keeps the MBR running at design flux and protects your membrane replacement budget (per ALAR, S4).
How big should my equalization basin be?
Size it for 2–4× average daily flow so it can absorb a CIP surge and blend it with off-peak production flow before anything hits the DAF. A basin sized only for average flow is the most common cause of biological-stage upset and effluent excursions in F&B plants (per Crystal Clean, S2).
Can I reuse treated wastewater for washdown?
Yes, with an MBR plus UV polishing train. Sub-1 μm membrane effluent followed by UV at 40 mJ/cm² is suitable for non-contact reuse such as floor wash, landscape irrigation, and boiler or cooling-tower makeup, subject to Virginia DEQ reuse-permit conditions and any site-specific HRSA cross-connection controls (per HydropureWater MBR and UV product data, 2026).
What happens if I miss a discharge limit?
The escalation chain in most F&B permits is: first violation triggers a surcharge on the excess loading and a written warning; repeated violations trigger increased self-monitoring (often daily sampling), a Notice of Violation, a mandate to install or upgrade pretreatment, and ultimately permit revocation with production shutdown in the most severe cases (per Crystal Clean, S2). Each step adds cost before any capital project is approved, which is why front-end pretreatment is consistently cheaper than a compliance response.