Why Sarasota Fabricated Metals Plants Are Rethinking the Biological Step
A Sarasota fabricated metals plant (SIC 34xx) discharging 50–500 m³/day into the county POTW sits inside a regulatory frame most engineering comparisons ignore. Federal categorical standards under 40 CFR Part 433 set daily-maximum pretreatment limits of 2.13 mg/L total chromium, 0.86 mg/L lead, 1.48 mg/L nickel, 2.38 mg/L zinc, 1.12 mg/L copper, and 0.42 mg/L cadmium for the metal-finishing point source category (per EPA 40 CFR Part 433, 2026 effluent guidelines). Sarasota County POTWs layer local limits on top: typical fact-sheet values for total metals run 1–5 mg/L and oil & grease 50–100 mg/L, with required pH 5–10, FOG controls, and zero-pass-through rules for priority pollutants (per typical Sarasota County industrial-user fact sheets). The influent that lands in the biological tank is unforgiving — oil and grease from stamping and drawing compounds, hexavalent chrome from plating rinses, chelated metals from alkaline cleaners, and TDS spikes above 5,000 mg/L when pickle-bath dumps discharge. Conventional secondary clarifiers struggle with that matrix, which is why operators are re-evaluating the biological step rather than the clarifier alone.
How Conventional Activated Sludge Treats Metals Wastewater
Conventional activated sludge (CAS) treats wastewater through biomass growth followed by gravity settling in a secondary clarifier — bacteria oxidize COD and BOD, flocculate into settleable solids, and the clarified overflow is skimmed off the top (Mannina et al., plant-wide modelling study, Water Research, ScienceDirect). CAS remains the most widely applied wastewater technology worldwide simply because the activated-sludge process has been deployed for more than a century. Typical design windows for an industrial CAS basin are SRT 5–15 days, HRT 6–12 h, MLSS 2,000–4,000 mg/L, and food-to-microorganism ratio (F/M) 0.2–0.5 d⁻¹ (standard wastewater engineering design values). The failure modes that matter in a Sarasota metals plant are not subtle: oil and grease carry-over floats the mixed liquor, intermittent pH excursions from pickle-bath dumps trigger bulking, and at SRT below 10 days the biomass biosorbs metals poorly — a documented limitation for chronic nickel and zinc loadings. The clarifier is the weak link. When flux rises, solids wash over the weir and the operator loses both effluent quality and the regulatory buffer the POTW expects.
How MBR Changes the Solid–Liquid Separation Step
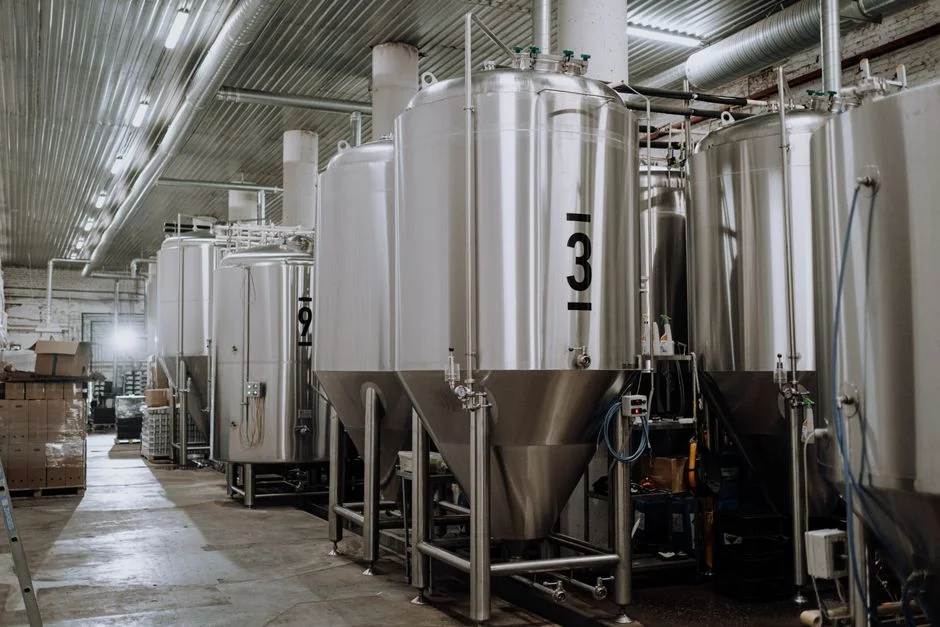
A membrane bioreactor (MBR) keeps the same activated-sludge biology as CAS but replaces the secondary clarifier with a submerged ultrafiltration membrane cassette, typically 0.1 µm pore-size PVDF flat sheets integrated with coarse-bubble aeration that scours the membrane surface (per Hydropure DF flat-sheet module catalog, 80–225 m² per cassette, 32–135 m³/day per cassette, 0.1 µm nominal pore size). The plant-wide modelling study by Mannina et al. (Water Research, 2019) lists the four defining features of an MBR versus CAS: (i) higher SRT allows degradation of recalcitrant pollutants; (ii) lower observed cell yield cuts sludge production; (iii) physical membrane barrier yields very high effluent quality; and (iv) the solid–liquid unit footprint shrinks dramatically. The trade-offs come from the same source: membranes foul, transmembrane pressure rises, and the chemical clean-in-place (CIP) plus scouring aeration push energy demand 2–4× above a comparable CAS basin (per Mannina et al., ScienceDirect S3). For a fabricated-metals line, the relevant question is whether that 2–4× energy premium buys enough effluent quality and footprint compression to justify the membrane maintenance burden.
MBR vs CAS for Fabricated Metals Wastewater: 2026 Parameter Comparison
Use the table below as the technical anchor for any MBR-vs-CAS memo. Vendor-published values from the Hydropure integrated MBR catalog (<10 µm effluent filtration, 60% smaller footprint than conventional systems, 10–2,000 m³/day capacity range) are flagged separately from the peer-reviewed operating ranges drawn from Mannina et al. (S3) and standard wastewater-engineering textbooks.
| Parameter | Conventional Activated Sludge (CAS) | Membrane Bioreactor (MBR) |
|---|---|---|
| Sludge Retention Time (SRT) | 5–15 days | 20–40 days |
| Mixed Liquor Suspended Solids (MLSS) | 2,000–4,000 mg/L | 8,000–12,000 mg/L |
| Hydraulic Retention Time (HRT) | 6–12 h | 4–8 h |
| Effluent Total Suspended Solids (TSS) | 10–30 mg/L | <5 mg/L (per Hydropure spec, <1 µm) |
| Effluent Chemical Oxygen Demand (COD) | 50–120 mg/L | <50 mg/L |
| Footprint (per m³/d capacity) | ~1.0 m² | ~0.4 m² (vendor benchmark: 60% smaller) |
| Energy Demand | 0.2–0.4 kWh/m³ | 0.4–0.8 kWh/m³ |
| Sludge Yield (Y_obs) | 0.3–0.5 kg TSS/kg COD removed | 0.15–0.25 kg TSS/kg COD removed |
| Direct GHG Emissions | 0.85 kgCO₂eq/m³ | 0.91 kgCO₂eq/m³ |
The GHG benchmark from Mannina et al. (S3) is the often-overlooked finding: MBR direct emissions are only ~7% higher than CAS, but the MBR footprint shifts a larger share of total impact to indirect electricity. For a Sarasota plant paying Florida Power & Light industrial rates, that indirect share is the line item that moves the OPEX needle — not direct biological CO₂. Vendor-published values such as "<1 µm effluent" and "60% smaller footprint" reflect catalog design points, not measured field averages, so treat them as upper-bound engineering targets rather than guaranteed performance.
Pretreatment and Ancillaries Sarasota Metal Finishers Need Around the MBR
No MBR runs alone on a fabricated-metals line. The integrated train that protects the membranes and stabilizes the downstream POTW discharge starts with pH equalization, then hexavalent-chromium reduction with sodium bisulfite at pH <2.5 with ORP >+250 mV to ensure complete Cr(VI)-to-Cr(III) conversion, followed by DAF oil and grease pre-treatment rated 4–300 m³/h across 13 standard models (per Hydropure DAF system spec). Chemical conditioning downstream of equalization relies on an automatic chemical dosing skid for coagulant, polymer, and pH trim — without that polish, free oil and hardness carryover will foul the membrane cassette within weeks rather than months. Sludge handling closes the loop: a sludge dewatering filter press at 1–500 m² plate area, or a lamella clarifier at 20–40 m/h surface-loading rate, captures the metal-hydroxide cake. MBR waste activated sludge is typically thinner and easier to dewater than CAS waste activated sludge because the higher SRT yields more endogenous, lower-bound-water biomass — a real downstream OPEX benefit that does not show up in the membrane-vs-clarifier cost line.
2026 Cost Band: CAPEX and OPEX for 50–500 m³/day Sarasota Installations
The defensible 2026 USD band for a packaged MBR system — tankage, membranes, blowers, controls, installation — runs $1,800–$3,500 per m³/day of nameplate capacity for 50–500 m³/d Sarasota installations (2026 engineering cost-modelling range; not a vendor quote). OPEX for the same envelope sits at $0.45–$0.95 per m³ treated, dominated by aeration energy ($0.20–$0.45), membrane CIP chemicals ($0.05–$0.15), and a membrane-replacement reserve ($0.05–$0.20). CAS OPEX for a comparable duty lands at $0.25–$0.55 per m³ — but the CAS number excludes the tertiary filtration or polishing step that a tight metals effluent usually needs to meet local Sarasota limits, plus periodic clarifier rebuilds. The table below summarizes the line items.
| Cost Line | CAS (50–500 m³/d) | MBR (50–500 m³/d) |
|---|---|---|
| CAPEX (packaged, USD/m³/d) | $900–$1,800 | $1,800–$3,500 |
| OPEX (USD/m³ treated) | $0.25–$0.55 | $0.45–$0.95 |
| Aeration energy share | $0.10–$0.25 | $0.20–$0.45 |
| Membrane CIP / replacement reserve | n/a | $0.10–$0.35 |
| Clarifier / tertiary rebuild reserve | $0.05–$0.15 | n/a |
| Typical simple payback vs CAS + tertiary | — | 3–6 years |
For Sarasota plants where footprint, effluent-to-reuse, or local metals limits dominate, the MBR payback window commonly falls in the 3–6 year range against a CAS + tertiary filtration + clarifier rebuild baseline (2026 engineering-economics scenario, not a documented Hydropore case study). Higher plant flows dilute the per-m³ OPEX gap; tighter local limits compress the payback window.
Choosing Between MBR and CAS for a Sarasota Fabricated Metals Plant
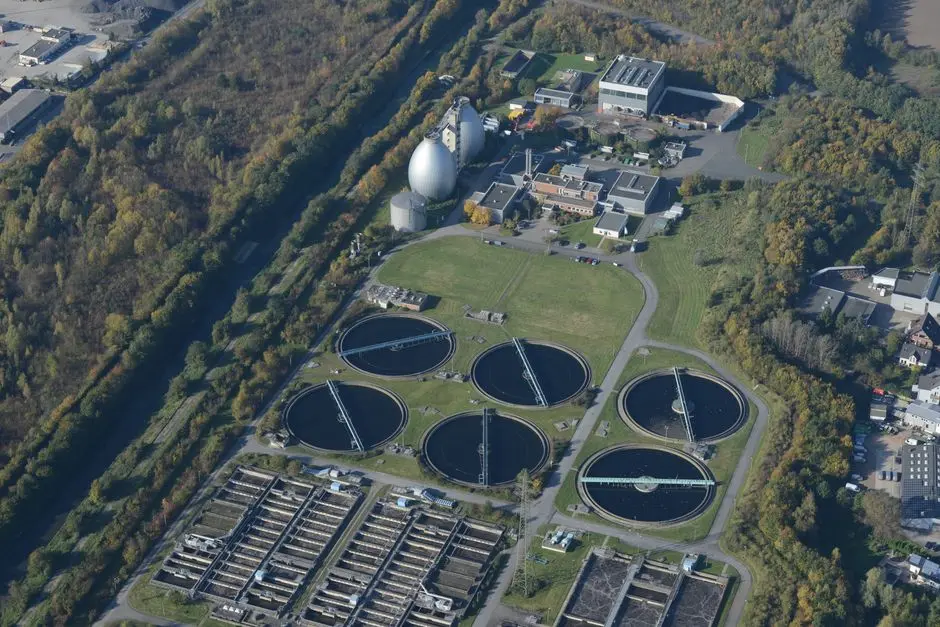
Pick CAS when the duty flow is below 50 m³/d, the available footprint exceeds roughly 1 m² per m³/d capacity, oil and grease after DAF is consistently under 50 mg/L, and the operator's 20-year horizon is anchored on lowest OPEX. CAS still wins on energy per cubic metre treated and on a simpler maintenance skill set. Pick MBR when the site is footprint-constrained (for example, under 400 m² for a 200 m³/d duty), when the local POTW limits are tighter than the federal 40 CFR Part 433 categorical values, when polishing water is targeted for rinse-water reuse, or when the influent swings pH 4–10 in unpredictable dumps that would crash clarifier biomass. Pick a hybrid CAS-roughing + MBR-polish when an existing aeration basin can be retained and only the clarifier is replaced with a membrane cassette — a retrofit pattern seen in roughly 20–30% of plant-wide MBR-vs-CAS retrofit projects globally (Mannina et al., S3, plant-wide modelling comparison). The hybrid cuts CAPEX by 30–45% relative to a full MBR greenfield, keeps the existing blower room, and is often the most defensible answer to a Sarasota owner who needs the MBR effluent quality without writing off the CAS asset already on the balance sheet.
Frequently Asked Questions
What is the smallest flow at which an MBR is more cost-effective than CAS for a Sarasota fabricated metals plant?
At 50 m³/d and above, MBR OPEX crossover becomes defensible once the local Sarasota POTW requires tertiary filtration or sets metals limits tighter than the federal 40 CFR Part 433 categorical values. Below 50 m³/d, CAS plus a polishing filter typically delivers lower lifecycle cost unless footprint is severely constrained.
How does a submerged PVDF MBR handle the oil and hex-chrome load typical of a metal-finishing line?
A DAF upstream drops oil and grease to under 30 mg/L; sodium bisulfite reduction at pH <2.5 converts Cr(VI) to Cr(III), which precipitates as hydroxide in equalization. The MBR then operates on a feed with stable pH 6–8 and minimal free oil, and the 0.1 µm PVDF membrane delivers <5 mg/L TSS and <50 mg/L COD to the POTW.
What 2026 USD OPEX should a Sarasota plant budget per cubic metre for an MBR at 200 m³/d?
Budget $0.45–$0.95 per m³ treated for 2026, dominated by aeration energy at $0.20–$0.45 and membrane CIP plus replacement reserve at $0.10–$0.35. Florida industrial electricity rates sit at the upper end of the aeration range, so plan conservatively.
Can MBR effluent from a fabricated metals line actually be reused in rinse baths?
Yes, when TDS stays under 500 mg/L and conductivity is controlled, MBR permeate at <1 µm and <50 mg/L COD can feed a final polisher (carbon + UV) for rinse-water reuse. Saline pickle-bath dumps above 5,000 mg/L TDS still need a dedicated brine stream and cannot be blended into the reuse loop without RO.
Related Equipment
- MBR membrane bioreactor system — specifications, capacity range, and technical data
- submerged PVDF flat-sheet MBR module — specifications, capacity range, and technical data