Why Dye Manufacturing Sludge Is a Different Problem
Dye manufacturing wastewater sludge is the combined waste activated sludge (WAS), DAF float, and primary clarifier underflow generated when dye-bearing effluent is biologically treated, and it is not a generic biological waste. The upstream process stream carries ~200 L of process water per kg of textile produced (Ghaly et al. 2014), with dye concentrations spanning 10–50 mg/L for general textile effluent (Laing 1991), 100–200 mg/L for reactive streams (Gahr 1994), 600–800 mg/L in heavy-use dye houses (Vandevivere 1998), and isolated reactive-dye discharges as high as 7,000 mg/L (Koprivanac 1993). Three contaminant families ride into the sludge: residual azo and reactive color bodies, aromatic-amine cleavage products, and dye-chromophore metals — Cr, Cu, Co, Zn, Fe (Adinew 2012; Hussein 2013). Conventional activated sludge handles the bulk COD but bleeds color into the clarifier, and the resulting floc has poor settleability that forces oversized sedimentation tanks (Yan 2014, HKUST). In 2026, designing a dye ETP means designing the sludge train first and the biology second.
Influent Characterization That Drives Sludge Design
Engineers must classify dye-bearing influent by both chemical structure (azo, anthraquinone, sulphur, phthalocyanine, triarylmethane) and application class (reactive, direct, disperse, basic, vat) before reactor selection, because each family generates a different aromatic-amine signature in the downstream sludge (Popli & Patel 2015). Real textile effluent envelopes a wide band: high color (1,000–1,500 ADMI units, O'Neill 1999), pH swings, suspended solids, COD, BOD, salinity, and elevated temperature (Yaseen & Scholz 2016; Dos Santos 2007). Representative dye concentrations to use at the design stage are 10–50 mg/L (Laing 1991), 100–200 mg/L (Gahr 1994), 600–800 mg/L (Vandevivere 1998), and 10–250 mg/L for dye-house streams (Ghaly 2014). The number that actually sizes thickeners and presses is the resulting WAS yield — typically 0.25–0.45 kg DS per kg COD removed at conventional mixed-liquor loadings, with elevated yield when dye-induced stress triggers lysis and pin-floc.
| Parameter | Typical range | Source |
|---|---|---|
| Process water use | ~200 L per kg textile | Ghaly et al. 2014 |
| Dye concentration (general) | 10–50 mg/L | Laing 1991 |
| Dye concentration (reactive) | 100–200 mg/L | Gahr 1994 |
| Dye concentration (heavy-use dye house) | 600–800 mg/L | Vandevivere 1998 |
| Dye concentration (extreme reactive case) | up to 7,000 mg/L | Koprivanac 1993 |
| Color intensity | 1,000–1,500 ADMI units | O'Neill et al. 1999 |
| Expected WAS yield | 0.25–0.45 kg DS per kg COD removed | HydropureWater field data, 2026 |
Reactor Choices and How They Shape the Sludge
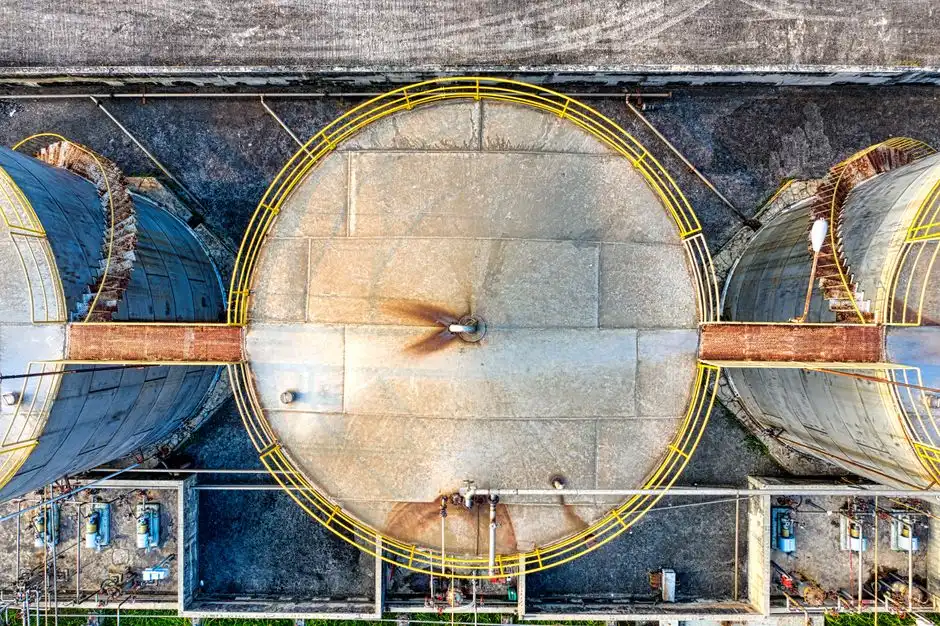
Reactor choice dictates sludge characteristics. Conventional activated sludge remains the workhorse but produces flocculent biomass with poor settling under dye loading, forcing large sedimentation tanks and high capex (Yan 2014, HKUST). Aerobic granular sludge (AGS) shifts the equation: granules 0.2–5 mm in diameter develop higher biomass density and faster settling velocity, and the oxygen-shielding outer layer creates an anaerobic core that enables simultaneous azo-bond reduction and aerobic aromatic-amine mineralization in a single sequencing batch reactor (SBR) (Yan 2014; Muda et al. 2010/2011). The classic two-stage train — anaerobic then aerobic — cleaves azo bonds reductively and then mineralizes the resulting amines (Khehra 2006; Popli & Patel 2015; Franca 2015). A submerged PVDF MBR at 0.1–0.2 µm pore size retains color colloids and biomass, producing near-reuse effluent and a thickened mixed liquor at 10–12 g/L MLSS that simplifies downstream thickening (Manavi 2016; Sadri Moghaddam 2016). For AGS in dye service, four operating parameters must be controlled: sludge particle size, bulk dissolved oxygen, biomass concentration, and nutrient concentration (Yan 2014).
| Reactor | Typical MLSS / SVI | Color removal | Sludge handling implication |
|---|---|---|---|
| Conventional CAS (flocculent) | 3–5 g/L MLSS; SVI 150–250 mL/g | 40–70% on azo; lower on reactive | Large clarifier; poor settleability under dye shock |
| Anaerobic–aerobic SBR | 4–6 g/L MLSS; SVI 100–150 mL/g | 70–90% on azo via reductive cleavage | Two-stage; amine-mineralization stage raises aeration cost |
| Aerobic Granular Sludge SBR | 6–10 g/L MLSS; SVI 80–120 mL/g | 80–95% on azo + reactive | Dense granules dewater to higher cake solids; less WAS volume |
| Submerged MBR (PVDF 0.1–0.2 µm) | 10–12 g/L MLSS | >95% color; near-reuse effluent | Thickened mixed liquor; membrane fouling from dye/colloid load |
The Sludge Train: Thickening, Conditioning, Dewatering
The sludge train begins once the reactor is selected. Thickening uses dissolved air flotation (DAF) for the oily, color-laden float from equalization and primary treatment, gravity thickening for flocculent WAS at 0.5–1.5% DS, and a membrane thickener or sieve drum when MBR MLSS exceeds 15 g/L. Conditioning is dominated by cationic polyacrylamide at 2–6 kg active per tonne dry solids, with lime or ferric chloride held as backup for metal-rich streams where polymer alone underperforms (HydropureWater field data, 2026). Dewatering selection is driven by cake-solids target: a plate-and-frame filter press for sludge dewatering produces 25–35% dry cake at 90–95% solids capture and remains the 2026 workhorse; screw presses deliver 18–22% cake at lower capital but higher polymer demand (see our screw press dewatering maintenance guide); centrifuges suit high-throughput plants; belt presses are rarely used on dye streams because of color carry-through in the wash water. End-of-life options include secure landfill, mono-incineration with heat recovery, cement kiln co-processing, and reuse of the dewatered cake — or pyrolyzed sludge-based activated carbon — as a low-grade dye sorbent (Sirianuntapiboon 2007; Hadi 2015). The process flow is straight: WAS plus DAF float → thickener → polymer conditioning → filter press → cake handling, with filtrate and pressate returned to equalization.
| Dewatering unit | Cake solids (% DS) | Solids capture | Typical polymer dose | Notes for dye sludge |
|---|---|---|---|---|
| Plate-and-frame filter press | 25–35% | 90–95% | 2–6 kg/t DS | Best cake dryness; default 2026 spec for >20 m³/d WAS |
| Screw press | 18–22% | 85–90% | 3–8 kg/t DS | Lower capex; cake often too wet for landfill bans >25% moisture |
| Decanter centrifuge | 22–28% | 90–95% | 2–5 kg/t DS | High throughput; sensitive to metal-rich grit |
| Belt press | 15–20% | 80–90% | 3–6 kg/t DS | Rarely used on dye streams; color carry-through |
Selecting Equipment for a 2026 Dye ETP Retrofit
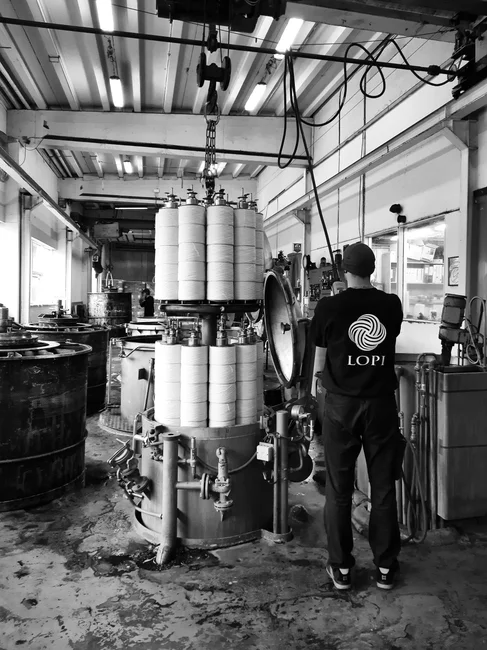
Specify the reactor based on influent variability and available footprint, then size the dewatering train on peak dry-solids per day, not the annual average. Match equipment to stream: a DAF system for color and float removal ahead of equalization strips dye-laden float and protects downstream biology; a lamella clarifier or an MBR membrane bioreactor for dye wastewater handles biomass separation and color retention (for a head-to-head on separation options see our DAF vs clarifier selection for chemical wastewater and the MBR vs SBR comparison for industrial wastewater). For plants exceeding 20 m³/d of WAS, the 2026 default spec is a fully automatic plate-and-frame press with 1–500 m² filtration area and PLC-controlled cycle, paired with an automatic polymer dosing skid sized to peak DS load. Compliance for 2026 frames disposal against EU Industrial Emissions Directive 2010/75/EU BREF for waste treatment, US 40 CFR Part 437 (the closest metal-finishing analog) where applicable, and local bans on landfill of liquids above 25% moisture — which is why cake-solids targets above 30% DS materially change the disposal route.
Operating and Cost Sensitivities in 2026
Polymer is the single largest variable OPEX line in dye ETP sludge handling, with dosing at 4–6 kg/t DS dominating the dewatering budget at 2026 polymer prices. Energy costs are driven by aeration in the biology stage; MBR and AGS raise aeration intensity per cubic meter but shrink downstream sludge volume, and that trade-off dictates most retrofit capex decisions. Landfill versus incineration tipping fees are the swing factor at end-of-life, and cake solids above 30% DS determine which disposal route is permitted and affordable.
Frequently Asked Questions
How much dye is in real dye-manufacturing effluent?
Real dye-house effluent typically runs 10–250 mg/L total dye across most mills, with 600–800 mg/L reported in heavy-use dye houses and isolated reactive-dye discharges reaching 7,000 mg/L; color intensity is commonly 1,000–1,500 ADMI units (Vandevivere 1998; Ghaly 2014; O'Neill 1999).
What biological process decolorizes azo dyes?
Anaerobic conditions cleave the azo bond reductively, producing aromatic amines that are then mineralized aerobically; this is why an anaerobic–aerobic SBR or an aerobic granular SBR with anaerobic cores is the 2026 default for azo-laden streams (Khehra 2006; Popli & Patel 2015; Yan 2014).
What cake solids should I target from the dewatering press?
Target 30–35% DS on a plate-and-frame press to