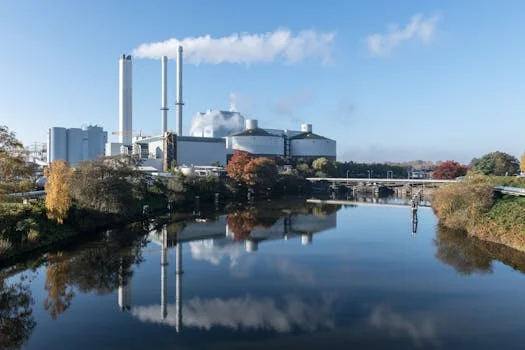
What Sets MBR and SBR Apart in 2025?
MBR delivers 0.1 µm-filtered effluent (TSS <1 mg/L, COD <30 mg/L) in a 30% smaller footprint than SBR, but consumes 2.5× more energy and adds 25% CAPEX. Choose MBR when reuse or stringent TP <0.5 mg/L is mandatory; pick SBR when power rebates or low-cost land favour gravity settling. The fundamental differentiator in 2025 remains the separation mechanism: MBR utilizes a 0.1 µm physical barrier that functions independently of sludge settleability, while SBR relies on a 1–2 m/h settling velocity dictated by biological health.
A 2023–2024 comparative study in Morocco confirmed that MBR systems achieve TSS removal exceeding 99% and COD removal of 94%, whereas SBR systems averaged 92% TSS and 86% COD removal under identical industrial influent conditions. This performance gap is driven by biomass concentration; MBRs typically operate at 8,000 to 12,000 mg/L MLSS, while SBRs are limited to 3,000 to 5,000 mg/L to prevent solids carryover during the decant phase. However, this higher biomass density in MBR comes at a significant power premium. Field data from 2023 industrial installations show an energy intensity of 0.45 kWh per kg-BOD for MBR, compared to just 0.18 kWh per kg-BOD for SBR. For a plant treating 2,000 m³/d, this energy delta can represent an additional 45,000 USD in annual utility costs, depending on local grid pricing.
Process Mechanisms: Why MBR Achieves Reuse-Quality Water
Membrane bioreactors decouple Hydraulic Retention Time (HRT) from Solids Retention Time (SRT), allowing high biomass concentrations without the risk of sludge bulking impacting effluent clarity. In an integrated MBR system, the membrane modules replace the secondary clarifier and tertiary filtration stages. These systems typically operate at a membrane flux of 15–25 L m⁻² h⁻¹ while maintaining 8–12 g L⁻¹ MLSS. Fouling control is managed through automated cycles of relaxation and backwash, often supplemented by air scouring to prevent the accumulation of extracellular polymeric substances (EPS) on the membrane surface.
SBR systems rely on timed batch cycles instead of physical filtration, making effluent quality dependent on biological settling. The Sequencing Batch Reactor (SBR) operates in a single tank through a timed sequence: Fill, React, Settle, Decant, and Idle. The decant rate is strictly limited to 0.3–0.6 m³ m⁻² h⁻¹, a parameter governed by the Sludge Volume Index (SVI). If the SVI exceeds 120 mL/g due to filamentous growth or nutrient imbalance, the SBR must extend its settling phase, which directly reduces the plant's daily hydraulic capacity. Data from a 2024 AquaEnviro survey highlights the resulting quality difference: MBR effluent consistently maintains a turbidity of 0.2 NTU, whereas SBR effluent fluctuates between 5–8 NTU, often requiring downstream sand filtration or ultrafiltration if industrial reuse is the goal. For engineers who need to troubleshoot MBR quality issues, the focus is usually on membrane integrity rather than biological settling dynamics.
| Parameter | MBR (Membrane Bioreactor) | SBR (Sequencing Batch Reactor) |
|---|---|---|
| Separation Method | 0.1 µm Physical Barrier | Gravity Sedimentation |
| Typical MLSS (mg/L) | 8,000 – 12,000 | 3,000 – 5,000 |
| Effluent Turbidity (NTU) | < 0.2 | 5.0 – 8.0 |
| Footprint Requirement | Low (No clarifier) | Moderate to High |
| Sludge Age (SRT) | 20 – 50 days | 10 – 25 days |
Industrial Load Tolerance: Which Technology Handles Shock Loads Better?
Industrial wastewater, particularly from food and beverage or chemical processing, is characterized by sharp COD spikes where concentrations can jump from 1,500 mg/L to 3,000 mg/L within a single shift. MBR systems demonstrate superior resilience to these fluctuations because the physical membrane prevents biomass loss even if the biology is temporarily stressed. When COD loading increases, MBR membrane flux may drop by approximately 12% per 1,000 mg/L COD increase due to higher viscosity and EPS production. However, this is largely recoverable by implementing 50% longer relaxation cycles or increasing air-scour rates until the biological community stabilizes.
SBR systems are sensitive to organic loading rate (OLR), which affects settling performance. A sudden surge in sugar or starch content can trigger filamentous bulking, increasing the SVI and slowing the settling velocity. To maintain an SVI below 120 mL/g during a shock load, an SBR operator must often extend the cycle time by 1.2 to 1.5 hours. This extension reduces the total number of cycles per day, effectively cutting the plant’s daily throughput by up to 15%. A case study from a Thai brewery illustrated this: during a 3-day sugar wash surge, the MBR unit maintained effluent COD below 30 mg/L by adjusting aeration, while the parallel SBR unit suffered from sludge carryover, resulting in effluent COD exceeding 150 mg/L and requiring a 20% flow diversion to emergency lagoons.
2025 Cost Breakdown: CAPEX, OPEX and Membrane Replacement
CAPEX for industrial wastewater treatment rose 7% in 2024, leading to 2025 MBR pricing of 480–520 USD per m³/d of capacity. The membrane modules represent approximately 35% of this investment. SBR remains the lower-cost capital option at 360–390 USD per m³/d, avoiding high-specification membranes, permeate pumps, and complex automated valve manifolds. However, the MBR vs extended aeration ROI calculation must account for the fact that MBR eliminates the need for a secondary clarifier and tertiary media filters, which can offset some of the initial price gap in land-constrained sites.
Operating expenses (OPEX) show the largest divergence between the two systems. Modern replaceable flat-sheet membranes made from PVDF now last 7–8 years with proper maintenance. As of early 2025, replacement costs are around 85 USD per m². Energy is the dominant OPEX factor; at industrial power rates averaging 0.12 USD/kWh, MBR energy use of 0.45 kWh per kg-BOD translates to 0.054 USD per kg of BOD removed. SBR, at 0.18 kWh per kg-BOD, costs about 0.021 USD per kg of BOD removed. For engineers defending budgets, this 150% increase in power consumption must be justified by eliminating downstream recycling costs or avoiding heavy environmental fines.
| Cost Category (2025 Data) | MBR Unit Cost | SBR Unit Cost |
|---|---|---|
| CAPEX (USD per m³/d) | $480 – $520 | $360 – $390 |
| Energy Intensity (kWh/kg BOD) | 0.45 – 0.65 | 0.18 – 0.25 |
| Membrane Replacement (USD/m²) | $85 (Every 7-8 years) | N/A |
| Chemical Consumption | High (Cleaning-in-place) | Low (Nutrients only) |
| Operator Skill Level | High (Automation/Sensors) | Medium |
Decision Matrix: Pick MBR, SBR or Hybrid?
Effluent requirements, land availability, and long-term energy strategy determine the best fit between MBR and SBR. If the project mandate specifies effluent Total Phosphorus (TP) <0.5 mg/L or turbidity <1 NTU for cooling tower makeup or boiler feed, MBR is the mandatory choice. The physical barrier is the only reliable way to meet these standards without a complex multi-stage tertiary treatment train. Conversely, if land is available and power costs exceed 0.15 USD/kWh, SBR is the superior financial choice, provided the effluent is destined for municipal discharge rather than high-grade reuse.
Hybrid MBR-SBR configurations are gaining traction in 2025 for plants in the 3,000–5,000 m³/d range. In this setup, 70% of the flow is treated via SBR for cost-effective bulk BOD removal, while 30% is diverted to an MBR for high-purity reuse water production. This split-flow approach can reduce total plant energy consumption by 18% compared to a full MBR installation while still meeting internal reuse targets. Use the matrix below to align your plant constraints with the appropriate technology.
| If your constraint is... | And your goal is... | Recommended Choice |
|---|---|---|
| Extremely Limited Space | Direct Industrial Reuse | MBR |
| High Power Costs (>0.15/kWh) | Municipal Discharge | SBR |
| Variable Organic Loads | Process Stability | MBR |
| Strict Nutrient Limits (TP/TN) | Environmental Compliance | MBR |
| Limited Capital Budget | Basic Secondary Treatment | SBR |
| High Reuse Target + High Power Cost | Balanced ROI | Hybrid (SBR + MBR) |
Frequently Asked Questions
Can MBR systems remove pharmaceuticals and microplastics better than SBR?Yes. Due to the 0.1 µm pore size and significantly longer Solids Retention Time (SRT), MBRs facilitate the growth of slow-growing nitrifying bacteria and other specialized microbes that degrade complex organic compounds. Studies show MBRs achieve 20–30% higher removal rates for persistent organic pollutants compared to SBRs.
What is the most significant disadvantage of MBR in industrial settings?The primary disadvantage is "irreversible fouling," where certain industrial chemicals or high oil and grease (O&G) concentrations bind to the membrane surface. This requires intensive chemical