
Why Coffee Wet-Mill Sludge Is a Distinct Engineering Problem
Coffee processing wastewater sludge treatment targets the biosolids generated by wet-milling 15–20 L of water per kg of green coffee bean, a benchmark documented by Dadi et al. 2018 (cited in S3). On a 10 t/day green-bean line, that ratio translates to 150–200 m³/day of process liquor carrying most of the cherry's organic mass. Wet by-products split as 43% pulp, 12% mucilage, and 6.1% parchment (von Enden et al. 2002, cited in S3), and the soluble fraction releases melanoidins, polyphenols, and caffeine that resist conventional biology. The settled and floated solids are acidic (pH 3.5–4.5), high in COD (often 10,000–25,000 mg/L in raw pulping liquor), and dewater poorly without conditioning because melanoidins and pectin carry a strong anionic charge. As S4 reminds engineers, "90 percent removal from 5,000 mg/L leaves 500 mg/L" — biology can clear the bulk of the load, but the residual solids it produces still require engineered thickening, digestion, and cake handling. Without a dedicated sludge train, biosolids accumulate in equalization basins, generate methane uncontrolled, and convert a manageable liquid discharge problem into an odor and vector issue that regulators do not accept.
Upstream Wastewater Train and Its Sludge Footprint
The liquid-side train sets the mass, type, and dewaterability of the solids that downstream equipment must handle. A typical 2026 green-mill sequence runs: screening → flow equalization → pH correction → anaerobic (UASB or AnMBR) → aerobic polishing → activated carbon → membrane filtration → ozone/UV disinfection. The 2026 integrated study in Materials (S1) reports this configuration delivered 82.4–95.4% TOC removal, 0–77.4% NH₄-N removal, 0–39.9% PO₄ removal, and 96.3–99.8% turbidity reduction at pH 4.02–7.25 on synthetic roasted-coffee effluent. For wet-mill streams specifically, Kondo et al. (cited in S3) combined a UASB with photo-Fenton at H₂O₂ 2.5×10⁻¹ mol/L and Fe²⁺ 6.3×10⁻² mol/L and reached 95% BOD removal, while Pérez et al. 2007 (cited in S3) used UV/H₂O₂ after coagulation–flocculation and reported 87% COD removal. These numbers are the ones that matter for sludge mass balance: every percentage point of COD stripped by biology converts into waste activated sludge (WAS) at roughly 0.4–0.6 kg DS per kg COD oxidized (HydropureWater field data, 2026). A MBR system for the upstream biological train tightens the footprint but increases sludge yield per m³ treated compared with a conventional activated-sludge basin. Anaerobic stages cut biological yield further because the COD leaves as biogas, not biomass, but the digester itself produces a co-thickened residual that the sludge train must still process.
| Liquid-side stage | Primary function | Sludge contribution | Reference |
|---|---|---|---|
| Screening / grit removal | Capture fibers, parchment, stones | 2–5% influent DS, low organic | Engineering practice |
| Equalization | Buffer hydraulic and organic surges | 5–10% settleable solids, acidic | S3 (Dadi et al. 2018) |
| UASB / AnMBR | High-rate anaerobic COD removal | Granular + flocculent sludge, 3–6% DS | S2 / S5 title evidence |
| Aerobic / MBR polishing | Residual COD, nitrification | WAS at 0.4–0.6 kg DS/kg COD ox. | HydropureWater field data, 2026 |
| Activated carbon + membrane | Color, melanoidin, residual COD | Spent carbon / concentrate bleed | S1 |
| UV / ozone disinfection | Pathogen control | Negligible solids | S1 |
Sludge-Handling Process Train: Thickening, Digestion, Dewatering
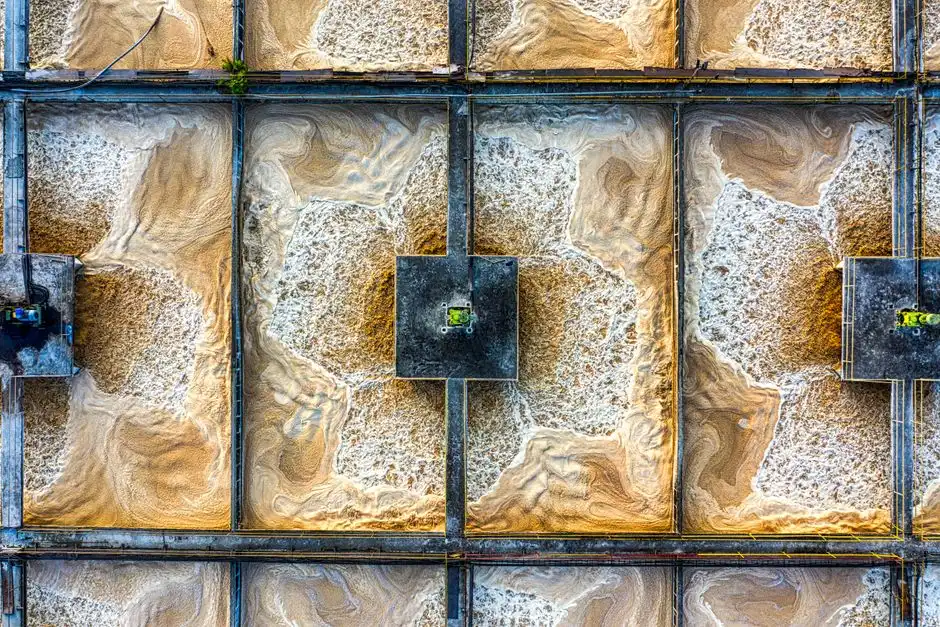
Once the upstream biology has done its work, the sludge train takes over in four discrete steps. Thickening targets 3–5% dry solids; a DAF system for sludge thickening is preferred over gravity thickeners when the feed carries high FOG and floated pulp fines, which is typical for coffee streams. Stabilization in a mesophilic anaerobic digester at 35–37 °C and 15–20 day HRT, or thermophilic at 50–55 °C and 12–15 day HRT, drops pathogen counts and generates usable biogas; the AnMBR co-digestion work indexed in S2/S5 is the high-solids reference architecture. Conditioning with cationic polyacrylamide at 4–10 kg active polymer per dry tonne of solids is the baseline, with lime or ferric chloride as backup when melanoidins suppress polymer performance. Mechanical dewatering with a plate-and-frame filter press for coffee sludge dewatering achieves 25–35% DS cake; belt presses reach 18–25% DS and decanter centrifuges 20–28% DS. Polymer dosing is delivered by an automatic polymer dosing system with on-line jar-test feedback. Cake end-of-life is typically composting with fresh coffee pulp at a 1:1 v/v ratio (closing the loop back to the plantation), landfill, or co-incineration in the mill's husk-fired boiler.
| Sludge unit operation | Design parameter | Typical range | Driver |
|---|---|---|---|
| DAF thickening | Hydraulic residence time | 20–40 min | FOG + floated pulp fines |
| Gravity thickener | Underflow DS | 3–5% | Low-FOG, fiber-light feed |
| Mesophilic digester | HRT | 15–20 days | VS destruction, biogas |
| Thermophilic digester | HRT | 12–15 days | Faster kinetics, pathogen kill |
| Polymer conditioning | Active dose | 4–10 kg/dry tonne | Cake DS target |
| Plate-and-frame press | Cake DS | 25–35% | Transport / disposal economics |
| Belt press | Cake DS | 18–25% | Lower capex, continuous duty |
| Decanter centrifuge | Cake DS | 20–28% | Variable flow, low operator skill |
Equipment Selection Matrix for Coffee Sludge Trains
Procurement decisions in coffee mills usually come down to three comparisons: thickener type, digester architecture, and dewatering hardware. A DAF thickener outperforms a circular gravity thickener on coffee sludge because floated pulp fines do not compact well under gravity; DAF reaches 4–5% DS versus 3–4% for gravity, and polymer demand is comparable at 3–6 kg/dry tonne. For digestion, a thermophilic AnMBR co-digesting coffee wastewater with WAS delivers the highest volumetric methane yield reported in the indexed literature (S2/S5 title evidence), but a conventional UASB remains the lowest-capex option for mills below 5 t/day green-bean throughput, and a covered anaerobic lagoon is acceptable for seasonal operations with abundant land. On dewatering, a plate-and-frame filter press for coffee sludge dewatering wins on cake dryness (30–35% DS routinely achievable), while a decanter centrifuge wins on footprint and operator simplicity; a belt press sits in the middle. An emerging option worth piloting is tamarind-seed polysaccharide flocculant (C T et al., Environ Res 2024), a natural conditioner that has shown effective COD reduction on coffee cherry pulping wastewater without the acrylamide concerns of synthetic CPAM. Use this rule of thumb: choose a plate-and-frame press when cake must exceed 30% DS for transport economics, and choose a centrifuge when flow is highly variable and the local operator pool cannot sustain a press crew.
| Decision | Option A | Option B | Pick A when… | Pick B when… |
|---|---|---|---|---|
| Thickener | DAF (4–5% DS) | Gravity (3–4% DS) | High FOG, floated pulp | Low FOG, limited capex |
| Digester | AnMBR (high CH₄ yield) | Conventional UASB | Energy recovery priority | Capex-sensitive, <5 t/day |
| Dewatering | Plate-and-frame (30–35% DS) | Decanter centrifuge (20–28% DS) | Long-haul cake transport | Variable flow, lean operator pool |
| Polymer | Cationic CPAM | Tamarind-seed polysaccharide | Proven dose-response | Natural-certification markets |
Operating Parameters, Polymer Dosing, and Monitoring
Day-to-day control of a coffee sludge train lives in four setpoints. Solids retention time in the digester should be held at 15–25 days for mesophilic mixed coffee + WAS co-digestion, with target volatile solids (VS) destruction of 45–60% — below 40% indicates under-loading or toxic inhibition from residual H₂O₂ if the upstream train is photo-Fenton. Polymer selection is cationic CPAM at 50–80% charge density and 8–12 MDa molecular weight, with jar testing on site before deployment; dose typically lands at 4–10 kg active per dry tonne of solids. Filter-press cycles run at 6–10 bar feed pressure with 15–20 minutes of pressing, producing 25–35% final cake DS; a diptest on the conditioned sludge should be performed during commissioning to verify that polymer selection has actually flocculated the colloidal melanoidin fraction rather than just bridging the larger particles. Monitoring is daily DS in feed and cake, weekly capillary suction time (CST) targeting <20 s for well-conditioned sludge, and weekly VS on the digester feed and discharge. An automatic polymer dosing system tied to influent flow and a streaming-current probe will hold dose within ±5% of target and is the single most cost-effective upgrade for unstable cake solids.
2026 Cost Envelope and ROI Considerations
For a green-mill wastewater treatment train in 2026, all-in operating cost is documented in the $0.05–$2.00 per gallon band in the 2026 wastewater-treatment cost-per-gallon engineering breakdown; a 200 m³/day coffee train lands in the $0.40–$0.90 per gallon midpoint of that range once the sludge train is included. OPEX splits roughly as polymer 25–35%, energy 20–30%, labor 15–25%, and cake disposal 20–30% (HydropureWater field data, 2026). Biogas revenue is meaningful: mesophilic co-digestion yields 0.20–0.35 m³ CH₄ per kg VS destroyed, which at 2026 industrial gas prices typically offsets 30–50% of digester OPEX. CAPEX for a 50 m² automatic plate-and-frame press package sits in the low six figures USD; where cake disposal is landfill-based at $40–$80 per wet tonne, the press pays back in 2–4 years, faster when the cake can be composted with pulp on-site and avoid tipping fees entirely. A 2026 supplementary guide on advanced oxidation treatment for organic wastewater covers the upstream CAPEX/OPEX interactions in more detail when polishing is required.
| Cost line | 2026 share of OPEX | Driver | Lever |
|---|---|---|---|
| Polymer | 25–35% | Dose × cake volume | Jar-test optimization, automatic dosing |
| Energy | 20–30% | Pumps, press, aeration | VFDs, biogas cogeneration |
| Labor | 15–25% | Operator hours | Automation, SCADA |
| Cake disposal | 20–30% | Transport + tipping | On-site composting with pulp |
| Biogas credit | −30 to −50% of digester OPEX | 0.20–0.35 m³ CH₄/kg VS | Co-digest WAS + coffee liquor |
Frequently Asked Questions
How much sludge does a coffee wet mill actually generate per tonne of green bean?
At 15–20 L of process water per kg of green bean and a by-product mass split of 43% pulp, 12% mucilage, and 6.1% parchment (S3, citing Dadi et al. 2018 and von Enden et al. 2002), a 10 t/day line produces roughly 6–9 dry tonnes of settleable plus waste activated sludge per 100 t of green coffee, depending on upstream biology yield. Combined with WAS, expect 8–12 dry tonnes per 100 t green bean.
What cake dry-solids target should engineers design for?
For landfill or co-incineration economics, design for 30–35% DS via a plate-and-frame filter press, which is routinely achievable at 6–10 bar feed pressure with cationic CPAM conditioning (4–10 kg/dry tonne). Cake below 25% DS is uneconomic to haul and complicates composting ratios.
Is anaerobic digestion of coffee sludge worth the capex?
Yes, above roughly 5 t/day green-bean throughput. Co-digesting coffee wastewater with WAS in a mesophilic digester at 35–37 °C and 15–20 day HRT yields 0.20–0.35 m³ CH₄ per kg VS destroyed, which at 2026 industrial gas prices offsets 30–50% of digester OPEX and typically delivers a 2–4 year payback when paired with a dewatering press.