What Drives Wastewater Treatment Cost Per Gallon
Wastewater treatment cost per gallon typically spans about $0.05–$2.00 for fully burdened industrial and small-plant cases, depending on flow, contaminant strength, and technology. Municipal systems with lighter loads often fall nearer $0.10–$0.50 per gallon on that same basis. Over a 10-year life, energy, chemicals, labor, and sludge usually outweigh amortized capital.
Flow rate is the first scale lever in any unit-cost model. Larger continuous flows dilute fixed operator, blower, and instrumentation costs, so treating about 1,000 GPM can approach $0.15 per gallon while about 100 GPM may near $0.50 per gallon on the same process family. Contaminant load is the second lever: petrochemical wastewater at 5,000 mg/L COD can cost three to five times more to treat than municipal wastewater near 250 mg/L COD under similar hydraulics.
Technology choice then locks the energy and chemical profile. Conventional activated sludge for moderate loads (BOD below 300 mg/L) often lands at $0.10–$0.30 per gallon. A high-efficiency DAF system for industrial wastewater is commonly $0.30–$0.80 per gallon where FOG or TSS dominate. An MBR system for water reuse and high-strength wastewater is often $0.50–$1.20 per gallon because membrane energy and module replacement add load.
Regulatory polishing adds a further slice when permits tighten. Tertiary steps aimed at stricter EPA or EU-style limits can add $0.10–$0.40 per gallon through filters, disinfection, or nutrient trim. Energy and chemicals remain the recurring drivers after commissioning: aeration, pumping, and membrane scour typically set the power bill, while coagulants, flocculants, and pH adjusters set the chemical bill.
Cost Per Gallon by Treatment Technology: DAF vs. MBR vs. Conventional Systems
Conventional activated sludge remains the municipal baseline for moderate BOD and TSS, with a large footprint and biological aeration as the main energy draw. These plants suit stable domestic-strength influent and sites that can accept clarifiers and long sludge ages. They trade land area for lower membrane and polymer intensity.
Dissolved air flotation fits food processing and pulp-and-paper streams rich in FOG or floatable solids. DAF trades higher coagulant and flocculant use for compact solids capture ahead of biological stages. Membrane bioreactors suit space-limited sites and reuse trains that need near-complete TSS rejection and stable effluent quality for downstream RO or non-potable reuse.
Capital intensity also diverges across technologies. Conventional plants are often planned near $5M–$15M per MGD of capacity, with operating cost around $0.15–$0.30 per gallon in the original planning band. MBR trains are often $10M–$25M per MGD. When reclaimed water displaces purchased supply, net operating cost for reuse cases can fall toward $0.50–$0.80 per gallon of product-water value.
Earlier site estimates near $12M per MGD remain a useful midpoint for complex industrial packages. 2023–2024 industry guides more often quote conventional secondary construction at about $2–$8 per gallon of installed capacity ($2M–$8M per MGD). MBR capacity costs land nearer $5–$15 per gallon before soft costs and difficult sites (Water & Wastewater, 2024). Keep CAPEX per MGD and O&M per gallon on separate lines so finance and operations review the same workbook without mixing units.
| Technology | Typical Cost per Gallon (USD) | TSS Removal Efficiency (%) | Footprint | Energy Consumption (kWh/m³) | Chemical Usage |
|---|---|---|---|---|---|
| Conventional Activated Sludge | $0.10 – $0.30 | 85 – 95 | Large | 0.3 – 0.8 | Moderate (nutrients, pH adjusters) |
| Dissolved Air Flotation (DAF) | $0.30 – $0.80 | 90 – 98 | Medium | 0.5 – 1.0 | High (coagulants, flocculants) |
| Membrane Bioreactor (MBR) | $0.50 – $1.20 | > 99 | Small | 0.8 – 1.5 | Moderate (cleaning chemicals, disinfectants) |
Operational Cost Breakdown: Where Your Money Really Goes
Energy usually dominates controllable O&M at mechanized plants. Earlier guidance placed energy at 30–50% of operating cost. Peer-reviewed U.S. plant data put electricity nearer 25–40% of operational expenses, while large municipal plants average about 2.5 MWh per million gallons treated (Chapin et al., Scientific Data, 2024).
Trade-press O&M splits for 2023–2024 still cluster energy at about 30–40%, chemicals at 10–20%, and biosolids at 10–25% (Water & Wastewater, 2024). MBR trains commonly draw 0.8–1.5 kWh/m³, so local $/kWh maps straight into unit cost. Demand charges and time-of-use tariffs can move the bill as much as blower efficiency.
Chemical spend covers coagulants such as PAC or ferric chloride, flocculant polymers, and pH adjusters. Dose control with a PLC-controlled chemical dosing system cuts overfeed without losing clarification performance. Labor and maintenance often take 15–25%, including membrane cleaning cycles and dewatering equipment such as a plate-frame filter press.
MBR membrane replacement alone can add $0.05–$0.20 per gallon over a 5–10 year module life, depending on influent fouling. Sludge disposal commonly adds 5–15% of O&M and tracks local landfill, incineration, or beneficial-use rules. Haul distance and cake dryness often matter more than the dewatering brand name on the nameplate.
For mid-size municipal plants (about 1–10 MGD), published O&M-only unit costs often fall near $1.50–$5.00 per 1,000 gallons treated in 2023–2024 guides. That basis differs from the fully burdened per-gallon industrial bands above (Water & Wastewater, 2024). Separating O&M-only figures from amortized capital avoids comparing unlike metrics in procurement reviews.
According to US EPA (2024), CapdetWorks-based Class 4 screening models for small replacement plants (0.01–2.00 MGD) carry roughly −30% to +50% accuracy. Those model outputs should be escalated from model-year dollars before budget lock (EPA 820-B-24-003). Early quotes therefore need contingency even when the process train looks firm.
How to Calculate Your Unit Treatment Cost: Step-by-Step Guide
Flow rate and contaminant load set the cost model before any equipment list does. Lock flow in GPM or m³/h and measure COD, BOD, TSS, and FOG so aeration power, chemical demand, and solids mass are grounded in data. Match technology to load and permit limits next: high FOG points to DAF; reuse-quality effluent points to MBR or tertiary membranes.
Estimate capital with a technology-adjusted MGD benchmark, then amortize over the civil and mechanical lives you actually finance. Use energy at about $0.10–$0.20 per kWh as a planning band. Recent municipal O&M write-ups place average U.S. commercial rates nearer $0.08–$0.15 per kWh (Water & Wastewater, 2024).
Add chemicals at roughly $0.50–$2.00 per pound of active product and labor at about $30–$50 per hour. Include sludge haul and membrane reserves in the same annual sheet. Divide amortized annual capital plus annual O&M by annual gallons treated to obtain unit cost.
Polishing stages such as an activated carbon filter operating cost line item belong in that O&M sum whenever residual organics drive tertiary spend. Keeping every consumable on one sheet prevents secondary trains from looking cheap until polishing appears later.
5 Ways to Reduce Treatment Costs Without Sacrificing Performance
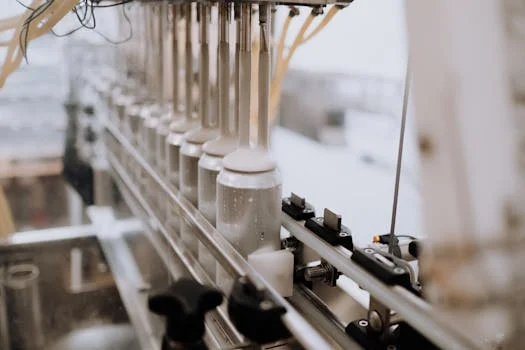
Variable frequency drives on pumps and blowers often cut energy use 20–30% by matching speed to real demand instead of continuous full load. Jar tests that set minimum effective coagulant and polymer doses can trim chemical cost 15–25% when historical overfeed is the norm. Online pH, DO, and turbidity sensors reduce manual sampling and stabilize control.
Water reuse with RO or UV tertiary treatment can reclaim 30–50% of treated flow, cutting intake purchases and discharge fees together. Preventative membrane cleaning, diffuser inspection, and planned spare replacement avoid emergency outages that dwarf routine maintenance spend. A chlorine dioxide generator for disinfection can sit inside that same reliability plan when residual control and by-product limits matter.
Selection checklist for a lower lifecycle unit cost:
- Map aeration, pumping, and membrane scour kWh against actual diurnal flow.
- Retest jar chemistry quarterly after process or raw-water changes.
- Automate DO and chemical feed before adding headcount.
- Quantify reuse credit as avoided purchase plus avoided discharge fee.
- Budget membrane and diffuser replacements on calendar, not failure.
- Track sludge wet tons and dry solids so haul contracts stay aligned.
- Re-run unit cost after each major O&M change, not only at CAPEX award.
What Does Cooling Tower Blowdown Recovery Cost?
Cooling tower blowdown recovery cost is driven by salinity, silica, and the CAPEX/OPEX split between pretreatment, membranes, and concentrate handling at the data-center or plant utility boundary. Softening or filtration ahead of RO protects flux. Reject disposal or crystallizer duty often dominates long-run OPEX when cycles of concentration rise.
Owners should meter conductivity and blowdown volume before sizing recovery so OPEX forecasts use measured load, not nameplate flow. When organics or chlorine residuals threaten membranes, fold in the same activated-carbon OPEX breakdown used for tertiary polishing on process wastewater. That keeps polishing chemicals and media changeouts visible in the payback model.
How do data center water upgrades pay back?
Data center water upgrades pay back when avoided makeup water, sewer surcharge, and chemical spend exceed amortized CAPEX inside the owner’s hurdle period. Industrial reuse trains often need five to ten years under stable tariffs and loads. Meter blowdown volume, conductivity, and discharge fees before selecting recovery hardware so ROI uses measured loads rather than brochure recovery rates.
Facilities that only need discharge compliance, not reuse credit, should compare simpler pretreatment against full recovery before locking CAPEX. A narrow compliance scope can beat a high-recovery flowsheet on unit cost when concentrate disposal is expensive. Document the decision rule in the basis-of-design so later scope creep does not erase the original ROI case.
Who this is for: plant engineers, EPC estimators, and procurement teams sizing industrial or municipal trains and needing a transparent unit-cost model. Who should look elsewhere: buyers seeking only potable-distribution tariffs or non-process utility rates without a treatment train. Next step: assemble flow, COD/BOD/TSS/FOG, and permit limits, then request a quote with those parameters for a technology-specific unit-cost check.
Frequently Asked Questions
What is the cheapest way to treat wastewater per gallon? Conventional activated sludge is usually the lowest unit-cost path for low-strength municipal wastewater, typically $0.10–$0.30 per gallon in the planning bands above. For industrial FOG or TSS-heavy streams, DAF at about $0.30–$0.80 per gallon often beats pushing those solids through a biological train alone. Always compare lifecycle O&M, not only installed CAPEX, before calling an option cheap.
How do energy costs impact wastewater treatment per-gallon pricing? Energy is a primary O&M driver and often 25–40% of plant operating expenses in recent U.S. datasets, versus older 30–50% planning rules of thumb. MBR systems drawing 0.8–1.5 kWh/m³ can add roughly $0.10–$0.30 per gallon at industrial power rates near $0.10–$0.20 per kWh. Local tariff structure, including demand charges, can move that band as much as process selection.
Can I reuse treated wastewater to reduce costs? Yes. Tertiary RO or UV trains that reclaim 30–50% of treated water can cut freshwater purchase and discharge fees together, with planning savings often cited near $0.05–$0.20 per gallon when both credits apply. Reuse only pays when product-water quality matches the end use and concentrate disposal is costed honestly. Pilot data on recovery and fouling should precede full-scale CAPEX.
What are the hidden costs of wastewater treatment? Hidden costs include sludge disposal at about 5–15% of O&M, MBR membrane replacement at roughly $0.05–$0.20 per gallon over module life, and permit monitoring fees. Emergency repairs after deferred maintenance commonly exceed planned service spend. Tertiary polishing and concentrate handling for reuse projects are frequent budget gaps in early estimates.
How do I estimate the ROI of a wastewater treatment system? ROI equals annual savings (lower discharge fees, reuse credits, avoided fines) divided by annualized CAPEX plus O&M, tracked until cumulative net cash turns positive. Many industrial projects show payback in about 5–10 years when loads and tariffs are stable. Re-run the model when electricity rates, sludge tip fees, or permit limits change.