Why the MBR vs CAS Decision Is Different for Fabricated Metals in Port Arthur
For fabricated metals wastewater in Port Arthur, MBR outperforms conventional activated sludge on effluent quality — typically TSS <5 mg/L, oil and grease <2 mg/L, and tighter residual metals — while cutting biological footprint by about 60% (per HydropureWater integrated MBR system specs). CAS remains cheaper to run long-term and tolerates higher shock loads of emulsified oil, but struggles to meet TPDES metals limits without tertiary polishing. Choose MBR when site footprint, water reuse, or strict metals limits dominate; choose CAS when CAPEX and oil-shock resilience dominate.
The influent envelope at a Jefferson County fabrication shop is the variable that makes this decision unrecognizable from a municipal CAS-vs-MBR comparison. Cutting, stamping, and stamping-lubricant rinsewaters contribute free and emulsified oil that routinely reaches several hundred mg/L, with intermittent slugs when a coolant sump dumps. Plating drag-out carries hexavalent chromium rinsewater at tens of mg/L alongside nickel and zinc at low mg/L concentrations, and pickling baths push total dissolved solids (TDS) into the multi-thousand mg/L range. Heat-treat operations generate intermittent, low-pH cyanide-bearing streams that cannot be sent untreated to a biological train. The binding constraint is the Texas Pollutant Discharge Elimination System (TPDES) permit issued by the Texas Commission on Environmental Quality (TCEQ), with metals and oil and grease limits that a conventional activated sludge (CAS) basin alone cannot meet on a consistent basis.
The Gulf Coast climate adds a second binding constraint. Sustained mixed-liquor temperatures of 30–35 °C in summer accelerate biological kinetics, but also accelerate membrane fouling in MBRs by promoting extracellular polymeric substance (EPS) release and fine-bubble-bound biomass. Operators on the Texas coast plan around this; engineers evaluating equipment do too. The choice between retrofitting an existing activated sludge basin and installing an MBR is therefore governed less by technology fashion than by three local questions: which contaminant is the most permit-likely to fail, is on-site reuse a strategic priority, and how much basin real estate can the site spare. The sections that follow work through each layer in the order an engineer needs to evaluate it.
How Each System Treats Oil, Metals, and Recalcitrant Load
CAS relies on floc-forming bacteria that aggregate biomass in the aeration basin; oil and grease are partly biodegraded but mostly float, are skimmed, or end up trapped in the waste activated sludge. Metals precipitate as hydroxides when pH is held in the typical 7.0–8.5 aeration range and report to the waste activated sludge for downstream dewatering. The failure modes on a fabricated-metals influent are well known and predictable: emulsified oil deflocculates the mixed liquor, washes out biomass, and pushes effluent TSS up; warm Gulf Coast mixed liquor drives filamentous bulking; and metal-rich floc settles poorly in a secondary clarifier already stressed by high MLSS and variable flow. When any of these conditions persist, effluent TSS drifts above 30 mg/L, residual metals rise with the suspended solids, and the plant loses margin under its TPDES permit.
MBR substitutes the secondary clarifier with a physical membrane barrier. A 0.1 μm PVDF membrane in the HydropureWater DF series flat-sheet MBR module rejects biomass, virtually all suspended solids, most oil droplets, and high-molecular-weight metal-organic complexes that would otherwise slip past a clarifier. The longer solids retention time (SRT) of 20–60 days, versus 5–15 days for CAS, supports slower-growing organisms that can degrade emulsifiers, chelating agents, and other recalcitrant compounds CAS cannot metabolize at typical SRT. MBR pore sizes in the 0.04–0.2 μm range retain nearly all bacteria and large viruses, which is operationally significant for plants that currently rely on CAS followed by chlorination or UV for disinfection.
The two systems converge on dissolved organics: both oxidize soluble BOD and COD through the same biological pathways. They diverge sharply on everything that requires physical retention. CAS depends on gravity settling, which fails under upset conditions; MBR depends on a membrane, which fails differently — through fouling, not breakthrough. Fouling is managed with chemical clean-in-place (CIP), physical cleaning, and scour aeration, and is the single largest variable driving MBR operating cost. On a fabricated-metals influent, where emulsions, oil, and chelated metals are routine, MBR's physical barrier and long SRT translate directly into lower effluent TSS, lower residual oil, and a more stable discharge to the TPDES-permitted outfall.
Head-to-Head Parameter Comparison: MBR vs CAS on Fabricated Metals Effluent
The table below consolidates the operating parameters a process engineer needs to defend a technology choice to plant management. Values are typical industrial ranges, anchored where possible to the Mannina et al. (2019) plant-wide comparison for GHG, and to HydropureWater MBR product specifications for footprint and module throughput.
| Parameter | CAS (typical) | MBR (typical) | Fabricated-metals implication |
|---|---|---|---|
| HRT | 4–8 h | 4–12 h | Comparable; MBR can run shorter at higher MLSS |
| SRT | 5–15 d | 20–60 d | MBR's long SRT degrades emulsifiers and chelators CAS cannot |
| MLSS | 2,000–4,000 mg/L | 8,000–12,000 mg/L | MBR runs at higher biomass without clarifier failure |
| Effluent TSS | 20–50 mg/L | <5 mg/L | MBR gives direct margin under TPDES suspended-solids caps |
| Effluent turbidity | 5–20 NTU | <1 NTU | MBR effluent is RO-ready without additional clarification |
| Effluent oil & grease | 10–30 mg/L | <2 mg/L | MBR's physical rejection closes the gap DAF cannot |
| Residual Ni / Cr / Zn | pH-dependent; tracks TSS | Lower; tracks near-zero TSS | MBR removes the suspended carrier of residual metals |
| Footprint (biological) | Baseline | ~40% of baseline (~60% reduction) | Decisive on space-constrained Gulf Coast sites |
| Energy demand | Lower aeration only | Aeration + scour + CIP; 10–20× lower for submerged vs cross-flow per DF module | MBR OPEX scales with fouling-control discipline |
| Direct GHG (Mannina 2019) | 0.85 kgCO2eq/m³ | 0.91 kgCO2eq/m³ | Difference is small relative to OPEX variables |
| Sludge production | Higher yield | Lower yield (low cell yield at long SRT) | Reduces downstream filter press sizing |
| Throughput envelope (HydropureWater MBR) | Site-specific | 10–2,000 m³/day system; DF cassette 32–135 m³/day | Covers most single-line fab shops |
| CAPEX | Lower | Higher (membrane modules, cassettes, CIP) | CAPEX premium offset by footprint and reuse gains |
| OPEX (long-term) | Lower (per Karim & Mark 2017) | Higher unless amortized over very long horizons (>67 yr per S2) | Lifecycle OPEX alone rarely drives the decision |
The single highest-leverage number in this table is MBR energy demand, which rises with membrane fouling mitigation — chemical CIP, physical cleaning, and scour aeration. Operators who run a stable upstream train (consistent DAF performance, controlled pH, controlled chelated-metal load) keep that number in check; operators who do not will see OPEX drift. The second highest-leverage number is footprint. On a Gulf Coast site bordered by tank farms or rail, the difference between baseline and ~40% of baseline is the difference between a feasible project and a stalled one.
Contaminant-by-Contaminant Performance for Fabricated Metals Streams
The engineer evaluating this decision will start with a worst-case contaminant, not a parameter list. The table below maps the four contaminant classes that drive TPDES excursions at Jefferson County fabricators to the system that handles each with the most margin.
| Contaminant | CAS effluent risk | MBR effluent risk | Why |
|---|---|---|---|
| Free & emulsified oil | High under upset; relies on DAF and skimming | Low; long SRT biodegrades emulsifiers; membrane rejects residual droplets | DAF upstream of either train is non-negotiable; MBR provides the residual margin |
| Hexavalent chromium (Cr⁶⁺) | Requires upstream reduction to Cr³⁺ at low pH in both trains; CAS effluent Cr tracks TSS | Same upstream reduction; tighter solids capture lowers residual total Cr | Biological step alone never reduces Cr⁶⁺; chemistry must come first |
| Nickel and zinc | Hydroxide precipitation at pH 9–10; high-volume metal-rich sludge | Same chemistry; precipitated floc retained in loop, cleaner effluent, higher in-reactor metal loading on membrane | MBR's effluent is cleaner at the cost of more careful membrane CIP chemistry |
| Cyanide (intermittent, heat treat) | Cannot rely on biological step alone; alkaline chlorination upstream mandatory | Same chemistry required | Free CN⁻ is a toxicity, not a TSS, problem; chemistry is the answer |
| TDS / sulfate (pickling) | Passes through both trains largely unchanged | Passes through both trains largely unchanged | Reuse targets (cooling-tower make-up) need RO downstream of either train |
The practical read of this table is that the biological step is only one barrier in a multi-barrier train. Upstream DAF, chromium reduction, and cyanide destruction are required regardless of whether CAS or MBR sits in the middle. What MBR changes is the residual: the last 10–30 mg/L of TSS and oil and grease that CAS cannot reliably hold, and which the TPDES permit will catch.
Port Arthur-Specific Drivers: Footprint, Climate, Reuse, and TPDES Compliance
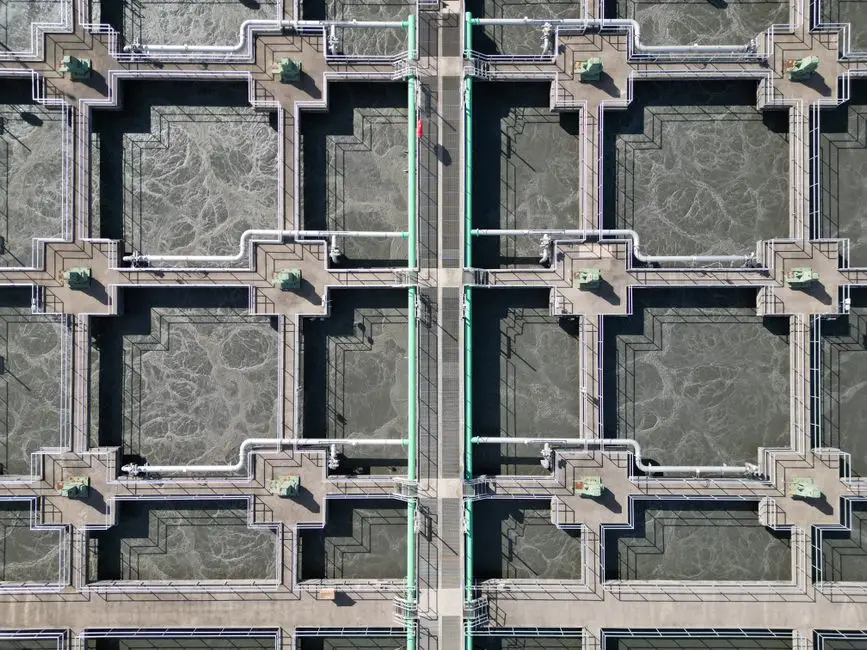
Port Arthur and Beaumont industrial sites are typically land-constrained, bordered by tank farms, rail corridors, and neighbors that limit where a new basin or a new cassette gallery can go. The biological footprint of an MBR is roughly 40% of an equivalent CAS basin (per HydropureWater MBR product spec), and on a tight site that ratio is often the deciding factor before the cost model is even run. The climate compounds the issue: sustained 30–35 °C mixed-liquor temperatures in summer accelerate biological kinetics, which is favorable for BOD removal but unfavorable for membrane fouling, since warmer mixed liquor releases more EPS and promotes fine-bubble-bound biomass. Operators on the Gulf Coast plan for this with disciplined DAF upstream, controlled SRT, and scheduled CIP; engineers specifying equipment should plan for it the same way.
Reuse is the second Port Arthur-specific driver. Texas water scarcity and industrial reuse incentives have made on-site reuse a defensible capital project for many Southeast Texas fabricators, particularly for cooling-tower make-up and process rinsewater. MBR effluent — low in TSS, low in oil, low in turbidity — is the right feed for an industrial RO system or even an ultrafiltration polishing step, with a low silt density index (SDI) that protects the RO membranes. CAS effluent usually needs an additional clarification stage before RO, eroding the apparent CAPEX advantage. TPDES compliance is the third driver: a solid-free MBR effluent provides measurable margin against permit excursions, while CAS requires vigilant sludge wasting and clarifier control to hold the same line. The body of evidence on Port Arthur-area industrial discharge supports a posture where compliance margin, not just nominal effluent quality, is the operational metric.
Decision Framework: When to Stay with CAS, Retrofit to MBR, or Build New MBR
The technology choice resolves to three conditions. Stay with CAS when CAPEX is the binding constraint, oil load is highly variable and the existing basin already has good DAF pretreatment, and TPDES limits have demonstrated margin under current operation. In that case, the upgrade path is targeted: tighten DAF chemistry, add an automatic chemical dosing system, and re-baseline the sludge-handling train against the existing basin.
Retrofit to MBR when the existing CAS clarifier is undersized, effluent TSS is consistently above 30 mg/L, and the site is space-constrained. Submerged HydropureWater DF series flat-sheet MBR modules can often drop into a repurposed basin, with the membrane cassette gallery replacing the secondary clarifier footprint. This path preserves civil-structure investment and shifts CAPEX into the modules and CIP skids rather than new concrete.
Build new MBR when a new fabrication line is being added, on-site water reuse is a stated corporate goal, or the upcoming TPDES renewal tightens residual metals or oil limits. New MBR is also the right call when the existing basin is at the end of its useful life and the plant needs to commit to a long-horizon effluent quality that CAS cannot guarantee under upset conditions. The Karim and Mark 2017 finding referenced in the Mannina plant-wide comparison is useful framing for the management conversation: MBR's higher capital cost is amortized only over very long operating horizons, so the decision is driven by footprint, reuse, and compliance margin, not by lifecycle OPEX alone.
For any of the three paths, pair the biological train with the right downstream sludge handling. Metal-rich sludge volume differs between CAS and MBR, and a plate and frame filter press sized to the lower-yield MBR waste stream is materially smaller and cheaper than one sized to a CAS waste stream. For facilities also evaluating upstream solids capture, our 2026 DAF vs clarifier guide for inorganic chemicals wastewater and our 2026 casting wastewater sludge treatment guide cover the same influent envelope from the sludge-handling side. Engineers evaluating CAS vs MBR against an activated-sludge baseline will also find our 2026 MBR vs activated sludge engineering comparison a useful cross-reference.
Frequently Asked Questions
Does MBR reliably meet TCEQ TPDES metals limits for fabricated metals in Jefferson County?
Yes, for total recoverable metals downstream of proper Cr⁶⁺ reduction and pH-controlled hydroxide precipitation, an MBR train delivers TSS under 5 mg/L and consistently lower residual Ni, Cr, and Zn than CAS, providing the compliance margin TPDES permits require. TCEQ still requires the upstream chemistry — Cr⁶⁺ reduction and CN⁻ destruction — regardless of the biological step chosen.
How much smaller is the biological footprint of an MBR versus a CAS basin?
About 60% smaller — an MBR biological footprint runs at roughly 40% of an equivalent CAS basin (per HydropureWater MBR product specifications). On a space-constrained Port Arthur or Beaumont site, that ratio is often the deciding factor before the cost model is run.
What is the realistic effluent oil and grease from an MBR on a fabricated-metals influent?
Under 2 mg/L with good DAF upstream, versus 10–30 mg/L from a comparable CAS basin. The 0.1 μm PVDF membrane in the HydropureWater DF series flat-sheet MBR module physically rejects oil droplets the secondary clarifier cannot hold.
Is MBR OPEX higher than CAS OPEX over the life of the system?
Yes, MBR OPEX runs higher than CAS OPEX in nearly every published comparison, driven by membrane fouling mitigation — chemical CIP, physical cleaning, and scour aeration. Karim and Mark (2017) found the higher capital cost is amortized only over very long operating horizons (over 67 years per their analysis), so the decision is rarely driven by lifecycle OPEX alone.
What throughput range does the HydropureWater MBR system cover?
The integrated MBR system covers 10 to 2,000 m³/day, with the DF flat-sheet module rated at 32 to 135 m³/day per cassette. That envelope covers most single-line fabricated-metals operations in Southeast Texas.