Why Rendering Plant Wastewater Needs Ultrafiltration
Rendering wastewater sits at the extreme end of industrial effluent strength, with COD typically 5,000–25,000 mg/L, BOD 3,000–10,000 mg/L, FOG 2,000–8,000 mg/L, total nitrogen 500–1,500 mg/L, and suspended solids 2,000–10,000 mg/L (per standard rendering industry characterization data, 2024). Conventional primary settling fails this stream because emulsified fats and dissolved proteins—stabilized by surfactants and shear from the cookers and presses—do not settle. A significant fraction of the FOG and protein-bound BOD passes straight through a clarifier into the discharge.
Ultrafiltration is the pressure-driven step that physically resolves this problem. With 0.001–0.1 µm pore size (per Racoman, 2024), UF retains emulsified fats, suspended proteins, and colloids that dissolved air flotation leaves behind. A DAF system for FOG and TSS pre-treatment removes the bulk floatable load, but it does not capture sub-10 µm emulsions. UF does. The 2019 Yavuz & Özçelik study in Chemosphere confirmed the configuration: coagulation followed by sand filtration followed by UF as the polishing reclamation step in a rendering wastewater train.
Operating flux of 40–80 L/m²·h and transmembrane pressure of 0.5–1.5 bar, with periodic backwash and CIP using alkaline detergent, lets the UF produce reusable water and concentrate the protein fraction for further recovery. The economic case is straightforward: protein retained in the concentrate has feed-value, and the permeate can meet sewer discharge limits or feed a downstream RO for boiler makeup.
How Ultrafiltration Works in a Rendering Wastewater Train
Ultrafiltration is a pressure-driven size-exclusion process: feed is forced at 0.5–2 bar against a semipermeable membrane with 0.01–0.1 µm pores, water and low-molecular-weight solutes pass through, and fats, proteins, and colloids are retained on the upstream side (per Racoman, 2024). Operating pressure is materially lower than nanofiltration or reverse osmosis, which makes UF the energy-efficient intermediate step between primary clarification and any high-pressure polish.
The standard process train for a 50–500 m³/d rendering wastewater stream runs as follows:
- Headworks — a rotary bar screen for rendering headworks removes feathers, bone fragments, and large solids; grit removal follows.
- DAF — a DAF system for FOG and TSS pre-treatment with coagulant dosing typically reduces FOG to 100–300 mg/L and TSS by 70–85%.
- Coagulation/flocculation — pH-adjusted (6.5–7.5) ferric chloride or polyaluminum chloride addition destabilizes emulsified FOG and dissolved proteins, forming settleable and floatable flocs.
- Sand filtration — multimedia filtration captures residual flocs and protects the UF from gross plugging (per Yavuz & Özçelik, Chemosphere, 2019).
- UF — 0.01–0.1 µm PVDF hollow fiber membranes, designed at 40–80 LMH flux, produce permeate meeting reuse or discharge targets.
- Optional RO polish — for boiler feed or high-purity reuse; UF protects RO by keeping Silt Density Index below 3.
The 2019 Chemosphere study demonstrated this exact sequence — coagulation → sand filtration → UF — as a viable reclamation train for rendering plant effluent, with UF as the unit operation that determines final water quality.
Membrane Selection for Rendering Duty: PVDF vs PES vs PS
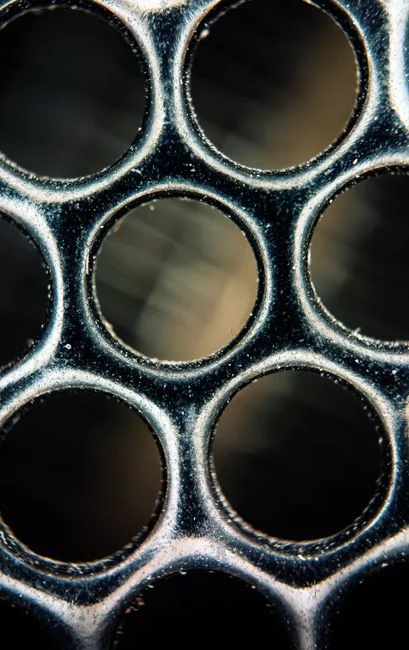
Membrane material and format drive both capital cost and operating life in a rendering UF. Three polymers dominate the commercial UF market, each with a distinct trade-off (per Racoman, 2024):
| Material | Mechanical strength | Chemical resistance | Fouling resistance | Best fit for rendering duty |
|---|---|---|---|---|
| Polysulfone (PS) | High | Good | Lower — hydrophobic surface attracts protein | Not preferred for FOG/protein streams |
| Polyethersulfone (PES) | Moderate–high | Good | Middle ground | Acceptable for moderate FOG (<2,000 mg/L) |
| PVDF | Lower | Excellent (alkaline CIP tolerant) | Best — inherently less hydrophobic | Default choice for high-FOG, high-protein rendering wastewater |
PVDF hollow fiber is the default for rendering wastewater because it tolerates the alkaline CIP chemistry (pH 11–12, 50 °C) required to dissolve fats and proteins without hydrolyzing, and its lower surface energy resists protein adsorption. Hollow fiber also wins on footprint: a high packing density (often >800 m² per skid) suits retrofit rendering plants where floor space is limited (per Racoman, 2024).
Format selection is a separate question. Flat sheet UF is easy to clean but has low packing density and rarely appears in rendering main process lines. Tubular UF handles very high-solids streams but consumes 3–5× the energy of hollow fiber at comparable flux. Reserve tubular UF for feed TSS exceeding 5,000 mg/L — typically only at the raw effluent stage, after which a DAF/coagulation step should bring TSS into hollow-fiber range.
Design Parameters: Flux, TMP, Recovery, and Backwash
The numbers below come from rendering UF operating data and standard membrane engineering practice. They are conservative defaults; a vendor should validate them with a 4–8 week on-site pilot on the actual effluent.
| Parameter | Design range (rendering UF) | Operating notes |
|---|---|---|
| Design flux | 40–80 L/m²·h (LMH) | Operate at 40–55 LMH when FOG > 3,000 mg/L |
| Transmembrane pressure (TMP) | 0.5–1.5 bar | Alarm at TMP > 2.0 bar — indicates fouling or fiber plugging |
| Permeate recovery | 85–95% | Concentrate returns to DAF or sludge handling |
| Cross-flow velocity | 0.5–1.5 m/s (hollow fiber) | Higher CFV improves fouling control at the cost of pumping energy |
| Backwash interval | Every 15–60 minutes of operation | 30–90 s per cycle, permeate + air-scour |
| Backwash flux | 1.5–2.0× forward flux | Air-scour at 0.1–0.3 Nm³/m²·membrane area |
| CIP frequency | Every 1–7 days | Driven by TMP creep between cleans |
| Alkaline CIP | NaOH 1–2% + surfactant, pH 11–12, 50–60 °C, 60–90 min | Targeted at fats and proteins |
| Acid CIP (if scaling) | Citric or nitric acid 1–2%, 35–45 °C | Use sparingly on PVDF |
| Oxidant CIP (if biofouling) | NaOCl 500–1,000 mg/L, 30–35 °C, 30 min | Verify PVDF oxidative tolerance with membrane supplier |
Design flux conservatively. The ScienceDirect 2019 bibliometric review found fouling is the dominant research topic in UF, accounting for 27% of all UF publications across 4,547 articles — a clear signal that operators consistently underestimate fouling risk. The single biggest lever is flux: cutting flux from 80 to 50 LMH can extend CIP interval from 1 day to 5–7 days, which more than offsets the additional membrane area required. Treat the 40–80 LMH range as a ceiling, not a starting point, for high-FOG rendering streams.
Fouling Control Strategies Specific to Rendering Effluent
Two fouling mechanisms dominate rendering UF. Organic fouling comes from emulsified fats and dissolved proteins depositing on and within the membrane. Biofouling develops as bacterial populations colonize the fouled organic layer, compounding flux loss with EPS production. The two require different pre-treatment, operational, and cleaning tactics.
Pre-treatment. Verify DAF effluent FOG is below 100 mg/L before UF — higher FOG will rapidly blind even PVDF membranes. Maintain coagulation pH at 6.5–7.5; protein isoelectric points cluster in this range, so floc formation is maximized and dissolved protein carryover to the UF is minimized. Pair coagulant dosing with an automatic chemical dosing for coagulation and CIP skid for repeatable control.
Operational tactics. Hold cross-flow velocity in hollow fiber at 0.5–1.5 m/s — high enough to shear foulants off the membrane surface, low enough to avoid pump cavitation and excessive energy draw. After any shutdown, ramp flux back to setpoint over 5–10 minutes; the most damaging fouling events in rendering plants occur after weekend or holiday stops when operators restart at full flux against a drained, partially dry membrane.
Cleaning tactics. Run an alkaline CIP first — NaOH + surfactant at pH 11–12 and 50 °C — to hydrolyze fats and solubilize proteins. If TMP does not recover to within 10% of the clean-membrane baseline, follow with 500–1,000 mg/L sodium hypochlorite at 30 °C to address biological fouling. Avoid blending oxidant and alkaline steps in the same CIP cycle; rinse thoroughly between them.
Integrating UF with RO for Water Reuse or Discharge
UF alone removes suspended solids, pathogens, colloids, emulsified fats, and high-molecular-weight proteins, but it does not remove dissolved salts, low-MW organics, or ammonia (per Racoman, 2024). Where the UF permeate goes next depends on the plant's water objective.
For boiler feed or closed-loop process water reuse, follow UF with an RO system for permeate polishing. UF's role is protective: it keeps the RO feed Silt Density Index below 3, removes the FOG and protein that would otherwise foul RO spacers, and stabilizes RO performance to design flux. For guidance on RO sizing itself, see the RO system design criteria reference.
For discharge to a municipal sewer (POTW), UF permeate typically meets BOD < 30 mg/L, COD < 150 mg/L, and TSS < 5 mg/L — comfortably within most municipal pretreatment programs. Confirm local limits; some U.S. POTWs require BOD < 250 mg/L at the connection, and UF alone clears that threshold with margin.
For plants where concentrate disposal is the bottleneck, route UF retentate to a plate and frame filter press for UF concentrate. The protein-rich solids cake has feed-value (typically 60–70% crude protein on a dry basis) and can be marketed as a meat-and-bone meal supplement, offsetting treatment operating cost. If you're new to dewatering sizing, the filter press sizing guide covers the same hydraulic and cake-thickness logic in a different context. For an alternative downstream separation step, the disc filter process flow walkthrough shows where a disc filter could substitute for or supplement sand filtration upstream of the UF.
Frequently Asked Questions
What pore size is typical for UF membranes treating rendering wastewater?
Standard UF pore size for rendering duty is 0.01–0.1 µm, with 0.02–0.05 µm being the most common range in operating plants. This range retains emulsified fats, proteins, and colloids while passing water and low-MW solutes (per Racoman, 2024).
How often does a rendering UF membrane need to be cleaned?
Run a backwash cycle every 15–60 minutes of operation (30–90 seconds per cycle, permeate plus air-scour), and schedule a full CIP every 1–7 days. The dominant variable is FOG and protein load — high-FOG streams (above 3,000 mg/L post-DAF) may need daily CIP, while well-DAF-treated streams can run 5–7 days between cleans.
Can UF replace DAF in a rendering wastewater train?
No. UF cannot economically replace DAF upstream — sending raw rendering effluent (FOG 2,000–8,000 mg/L) directly to UF would blind the membrane within hours. DAF is required to reduce FOG below 100 mg/L before the UF; the two are complementary, not substitutes.
What flux should I design a rendering UF to?
Design for 40–80 L/m²·h, but plan to operate at the low end — 40–55 LMH — whenever post-DAF FOG exceeds 3,000 mg/L or when protein-bound BOD is high. Conservative flux extends CIP interval, reduces chemical consumption, and typically improves membrane life by 30–50% over a 5-year horizon.