

Ultrafiltration Process Flow Diagram: Core Blocks
An ultrafiltration process flow diagram is a PFD of feed prefiltration, a feed pump at 0.5–2.5 bar TMP, and cross-flow UF modules (0.001–0.05 μm pores; MWCO 1–500 kDa) that split permeate and concentrate. The same drawing shows the backwash loop and CIP skid, with typical design flux 50–150 L/m²·h at 85–95% recovery for RO pretreatment, oily wastewater, and protein concentration.
UF sits between nanofiltration and microfiltration on the membrane spectrum, with pores sized 0.001–0.05 μm (ScienceDirect, Zeman & Zydney 1996). Molecular weight cut-off is the size-discrimination spec engineers use to pick a membrane. By the most common definition, a stated MWCO rejects 90% of solutes above that molecular weight. The working MWCO band for industrial UF runs from 1 kDa to 500 kDa—a span of more than two orders of magnitude that covers virus and protein removal through oil-water separation.
A typical PFD carries seven blocks plus a reject/concentrate stream: raw feed inlet, prefiltration, feed pump, UF membrane modules with recirculation, permeate storage, backwash loop, CIP skid, and concentrate handling. The PFD is not a P&ID—the PFD shows streams, mass balance, and operating pressures; the P&ID adds valves, instruments, control loops, and the piping class. For a spec or a bid review, the PFD is where the engineer checks that the train is sound; the P&ID is where the details get argued.
Feed Inlet and Pretreatment Stage
Raw feed to an industrial UF train includes surface water, secondary effluent, RO concentrate, dairy whey, fermentation broth, and oily wash water (ScienceDirect, Zeman & Zydney 1996). These feeds carry particulates, oils, or biological material that foul or score the membrane if sent straight to the modules, so the prefilter is the first hard protection step.
For most industrial feeds, specify an 80–200 mesh strainer or a 50–200 μm backwashable prefilter ahead of the pump suction. The rotary mechanical bar screen in the headworks removes rags, plastics, and large debris before finer screening. For oily or high-fouling feeds—food processing, metalworking, refinery desalter effluent—install a DAF or lamella clarifier upstream to drop FOG and TSS. A HydropureWater lamella clarifier or a dissolved air flotation unit is the standard pick; both bring TSS below 30 mg/L before the feed reaches the UF prefilter.
Prefilter pressure drop is a useful fouling sensor. Hold clean ΔP below 0.3 bar and trigger an automatic backwash at 0.7 bar differential. That two-threshold window keeps the strainer from loading debris into the modules, and the automated backwash stops differential pressure creep from becoming a TMP problem on the UF side. Most plants we size for oily wash water run the prefilter backwash closer to the 0.7 bar trip than to a fixed timer.
Feed Pump, Pressurization, and Cross-Flow Loop
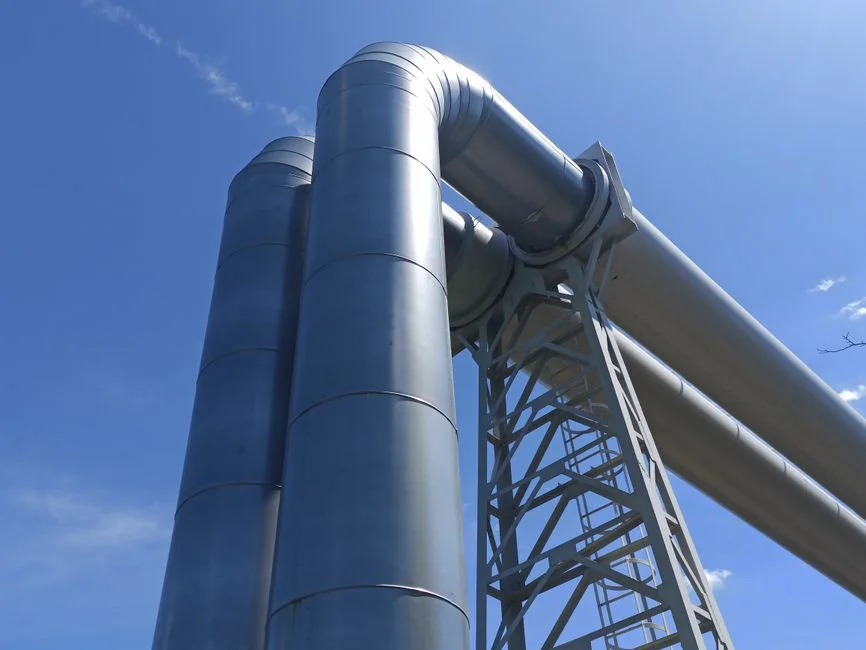
The feed pump sets both the transmembrane pressure and the cross-flow velocity that keeps the membrane surface scoured. Specify a centrifugal stainless steel pump sized for 1.2–1.5× design flow with VFD control, and a discharge pressure of 2–4 bar to overcome both TMP and loop piping losses. VFD control lets the operator trim flux and cross-flow as feed conditions shift.
TMP is the pressure differential between feed/concentrate and permeate sides of the membrane. The standard UF operating window is 0.5–2.5 bar; in submerged UF/MBR configurations TMP is much lower, typically 0.1–0.3 bar, because the membrane sits in the mixed liquor and a static head supplies the driving force. Permeate flux through a porous membrane follows Darcy's law of flow through porous materials:
J = A · ΔP
where A is the membrane permeability constant and ΔP is the transmembrane pressure. The Hagen–Poiseuille pore-flow form (ScienceDirect, Zeman & Zydney 1996) is:
J = (ε · r² · ΔP) / (8 · μ · τ · Δx)
where ε is porosity, r pore radius, μ dynamic viscosity, τ tortuosity (≈1 for cylindrical pores), and Δx membrane thickness. Flux scales linearly with TMP and with the square of the pore radius. Doubling pore size quadruples clean-water flux but also raises solute passage.
Cross-flow velocity controls concentration polarization and fouling. Hold 0.5–2 m/s in tubular UF modules and 0.1–0.5 m/s in hollow fiber—high enough to sweep retained solids off the membrane surface, low enough to keep pump energy efficient. Recovery is set by the recycle ratio: aim for 85–95% with concentrate recycle back to the feed tank, and bleed 5–15% to downstream handling.
UF Membrane Modules: Configuration and MWCO Selection
Module format and MWCO drive both capex and operating cost. Four formats dominate industrial UF. Hollow fiber offers the highest packing density and is backwashable, so it is the default for water and wastewater. Spiral wound costs least per m² but has no backwash, so it fits RO pretreatment and food duty. Tubular modules accept high-fouling, oily, or high-solids feeds and CIP well. Flat sheet suits MBR cassettes that must be easy to handle and replace. For water and wastewater, PVDF hollow fiber is standard; for hot, aggressive, or solvent feeds, ceramic UF is the preferred choice despite higher capex.
MWCO selection follows the target species. The table below maps common applications to a working MWCO band and a typical design flux.
| Application | Target species | MWCO band | Typical flux (L/m²·h) | Module format |
|---|---|---|---|---|
| UPW semiconductor polishing | Colloidal silica, particles <0.1 μm | ≤10 kDa | 60–120 | Cross-flow hollow fiber or spiral wound |
| Protein / enzyme concentration | Proteins 10–500 kDa | 10–30 kDa | 30–80 | Flat sheet or thin-channel |
| Dairy whey, juice clarification | Lactose, sugars, suspended solids | 30–100 kDa | 50–100 | Spiral wound or tubular |
| RO pretreatment, oil-water | TSS, oil droplets, SDI reduction | 50–100 kDa | 50–150 | Hollow fiber (backwashable) |
| MBR mixed liquor | Biomass, colloids | 0.03–0.4 μm rating | 15–40 | DF series PVDF flat sheet UF modules |
Cross-flow UF with MWCO ≤10 kDa is used as final polishing in UPW semiconductor plants targeting fewer than 10 counts/L at 0.2 μm (Zeman & Zydney 1996). Design flux in water and wastewater UF is 50–150 L/m²·h; high-fouling streams like fermentation broth and oilfield produced water run lower, often 20–50 L/m²·h. The 0.001–0.05 μm pore band is the universal UF envelope.
What Does an MBR Process Flow Diagram Include?
An MBR process flow diagram shows an activated-sludge bioreactor coupled to UF or MF membranes that replace secondary clarification. Mixed liquor recycles to the aeration tank, and permeate is drawn under 0.1–0.3 bar TMP. A standalone ultrafiltration process flow diagram omits aeration and sludge wasting; the MBR drawing adds those blocks and often an anoxic zone for nitrogen control. Membrane flux in MBR duty is lower—typically 15–40 L/m²·h—because mixed liquor suspended solids often sit at 8,000–12,000 mg/L. Flat-sheet or hollow-fiber cassettes sit in the tank, so the PFD must show air scour, permeate pumps, and CIP as core blocks.
How Does an MBBR Process Flow Diagram Differ from UF?
An MBBR process flow diagram centers on a biofilm reactor with free-moving plastic carriers, an aeration grid, and a downstream clarifier or sieve. It is not a pressurized membrane skid. Unlike UF, MBBR does not produce low-SDI permeate for RO feed without further solids removal. Many plants we size for municipal upgrades run MBBR for BOD and ammonia, then add UF or an Underground Package Sewage Treatment Plant (WSZ Series) polishing step when reuse or tight limits apply. Choose the MBBR drawing for carrier fill, sieve aperture, and blower turndown; stay on the UF PFD for TMP, MWCO, and backwash timing.
Where does an activated sludge process diagram stop and UF begin?
An activated sludge process diagram ends at secondary clarification and return/waste sludge lines. UF begins when a membrane replaces or follows that clarifier to polish TSS and colloids before reuse, discharge, or RO. The handoff stream is secondary effluent or mixed liquor; the UF PFD then owns prefiltration, TMP control, backwash, and CIP.
Permeate Storage and Backwash Loop
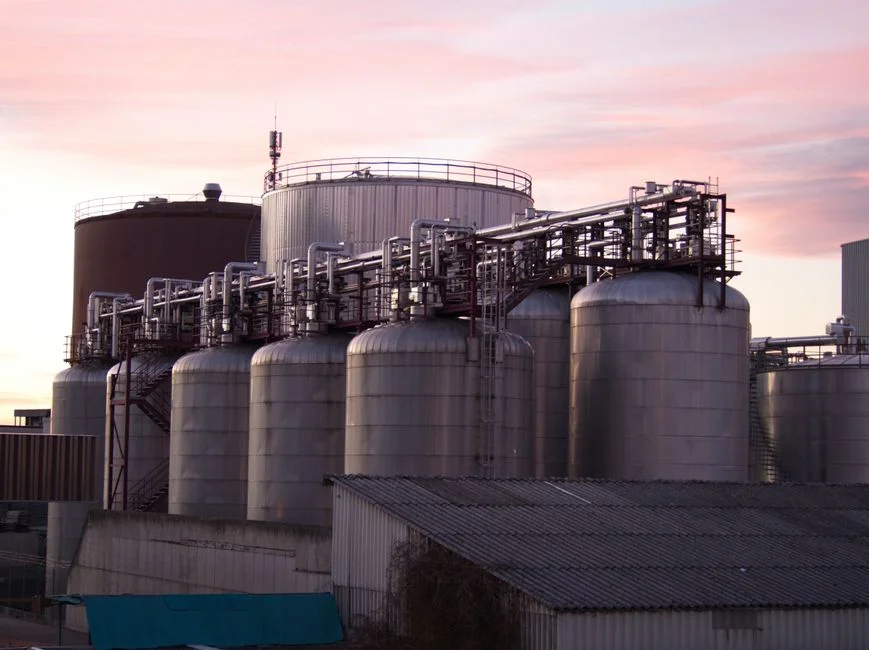
Permeate storage smooths the swing between the UF train running at design flow and downstream processes pulling intermittently. Size the permeate tank at 15–30 minutes of design flow and use a level transmitter to feed back to the feed-pump VFD. This loop allows the pump to slow when the tank is full and ramp when it drains, cutting energy use and mechanical wear.
Backwash is the daily maintenance step that prevents membrane blinding. Trigger it every 20–60 minutes during operation, or when TMP rises 0.2–0.4 bar above the clean baseline. The backwash water source is UF permeate, dosed with 5–50 mg/L free chlorine or 0.5–2% H₂O₂ to control biological fouling. Run backwash flux at 1.5–2.5× the forward flux for 30–90 seconds per cycle to displace the foulant layer. Direct the backwash waste to a small equalization tank and recycle it to the feed pump suction to keep recovery above 90%.
CIP Skid and Reject Handling
When backwash is insufficient, a clean-in-place (CIP) cycle is required. Run CIP every 1–7 days depending on feed; trigger it when normalized flux drops 15–20% from the clean baseline or when TMP rises 0.5 bar despite backwash. CIP chemistry is feed-specific: 0.5–2% NaOH at 30–50 °C for organic and protein fouling, 0.5–1% citric or nitric acid for calcium and metal scalants, 200–500 mg/L NaOCl for biological fouling.
The CIP skid is a separate loop consisting of a dedicated tank, a heater, a circulation pump, and return piping. It must isolate the train under cleaning from the rest of the plant to prevent chemical contamination of the permeate. Chemical dosing is best handled by a HydropureWater automatic chemical dosing system tied to the CIP controller, which holds the dose within the spec window. The semiconductor ultrapure water plant design walkthrough covers the cleaning chemistry in more depth for high-purity duty.
Concentrate handling is the stream the PFD often glosses over. Five to fifteen percent of feed volume becomes concentrate, and disposal depends on downstream capacity: RO concentrate, an evaporator, or a sludge dewatering step such as a plate-and-frame filter press. For UF used as RO pretreatment, returning the concentrate upstream of the clarifier simplifies mass balance and reduces raw-water make-up.
Design Parameters Summary Table
The table below provides a one-page reference for a UF spec, with every row linking back to a section above.
| Parameter | Typical range | Notes |
|---|---|---|
| MWCO | 1 kDa – 500 kDa | Select by target species (see section 4) |
| Pore size | 0.001 – 0.05 μm | Universal UF band |
| Transmembrane pressure (TMP) | 0.5 – 2.5 bar (pressure UF); 0.1 – 0.3 bar (submerged MBR) | Darcy's law: J = A·ΔP |
| Design flux (water/wastewater) | 50 – 150 L/m²·h | Lower for high-fouling streams |
| Cross-flow velocity | 0.5 – 2 m/s (tubular); 0.1 – 0.5 m/s (hollow fiber) | Balances scour vs pump energy |
| Recovery | 85 – 95% | Concentrate recycled to feed |
| Backwash frequency | Every 20 – 60 min | Triggered by TMP rise of 0.2 – 0.4 bar |
| Backwash flux | 1.5 – 2.5× forward flux | 30 – 90 s per cycle |
| CIP frequency | Every 1 – 7 days | Triggered by 15–20% flux loss or +0.5 bar TMP |
| Module format | Hollow fiber (default), spiral wound, tubular, flat sheet | PVDF for water; ceramic for hot/solvent |
UF Selection Checklist and Cost Drivers
Before freezing the PFD, walk this checklist with the process owner:
1. Confirm feed TSS, FOG, and temperature so prefiltration and module format are not undersized.
2. Lock MWCO to the smallest species that must be rejected, not to a catalog default.
3. Set design flux at the lower end of 50–150 L/m²·h when fouling risk is high.
4. Size the feed pump for 1.2–1.5× design flow with VFD headroom for TMP rise.
5. Define backwash and CIP triggers in the control narrative, not only in the O&M manual.
6. Show concentrate disposal on the PFD—recycle, RO, evaporator, or dewatering.
7. Match CIP chemistry to the dominant foulant before buying the chemical skid.
Main cost drivers are membrane area (flux and recovery), module format (hollow fiber vs tubular vs ceramic), and cleaning frequency. Energy follows cross-flow velocity and TMP; chemical cost follows CIP interval and dose strength. Compact package plants such as the Underground Package Sewage Treatment Plant (WSZ Series) fold pretreatment and membrane polishing into one footprint when civil space is tight.
Who This Is For / Who Should Look Elsewhere / Next Step
This walkthrough is for plant engineers, EPC reviewers, and procurement teams who must approve a UF train PFD before bid or FAT. Look elsewhere if the scope is only biological treatment without membranes, or if the drawing needed is a full P&ID with instrument tags. When the mass balance, MWCO, and cleaning logic are settled, send the feed analysis and duty through our UF system inquiry form so the skid can be sized against the same numbers on this page.
Frequently Asked Questions
What does an ultrafiltration system process flow diagram show?
An ultrafiltration system process flow diagram maps feed through prefiltration, the pressurized UF modules, permeate storage, backwash, CIP, and concentrate handling. It states stream duties, TMP windows, and recovery targets so a reviewer can check mass balance before opening the P&ID. Instrumentation on a PFD is limited to the sensors needed for those duties; valve class and loop detail stay on the P&ID.
What is the typical transmembrane pressure and flux for industrial UF?
Industrial pressure UF typically runs at 0.5–2.5 bar TMP, while submerged MBR membranes often sit at 0.1–0.3 bar. Design flux for water and wastewater UF is usually 50–150 L/m²·h at the stated temperature and fouling class; high-solids feeds often drop to 20–50 L/m²·h. Holding TMP above about 2.5 bar on polymeric modules raises compaction and irreversible fouling risk without a lasting flux gain.
How often should you backwash a UF membrane and when do you trigger CIP?
Backwash every 20–60 minutes of production, or when TMP rises 0.2–0.4 bar above the clean baseline, for 30–90 seconds at 1.5–2.5× forward flux. CIP follows every 1–7 days when normalized flux falls 15–20% or TMP rises 0.5 bar despite backwash. Use alkaline cleaner for organics, acid for scalants, and 200–500 mg/L NaOCl when biology dominates the foulant layer. Clean-in-Place (CIP) procedures are triggered when the TMP increases by 20% to 30% above the baseline established at commissioning, or when the permeability (flux divided by TMP) drops below 70-80% of its initial value. If backwashing fails to restore TMP to within 10% of the baseline, a chemical CIP using acids (for inorganic scaling) or bases/oxidants (for organic fouling) is required.
What MWCO should I select for RO pretreatment versus protein concentration?
For RO pretreatment, 50–100 kDa is the usual MWCO band to cut TSS, bacteria, and large organics while keeping flux high. Protein concentration needs a tighter cut, typically 10–30 kDa in the application table, and often 3–30 kDa when the product protein is small. Pick an MWCO several times smaller than the target protein molecular weight so rejection stays high through diafiltration.
What is the difference between cross-flow and dead-end ultrafiltration?
Dead-end UF forces all feed through the membrane, so solids cake on the surface and the mode fits only low-TSS feeds. Cross-flow sweeps feed tangential to the membrane at 0.1–2 m/s depending on module type, slowing cake growth on oily, biological, or high-solids streams. Industrial RO pretreatment, dairy whey, and oil-water duty therefore default to cross-flow despite higher recirculation energy.
Related Equipment
- hollow-fiber ultrafiltration system specifications — Engineers mapping UF process flow can match each stage to a rated commercial system.