Why Forward Osmosis Commissioning Is Different From RO
FO flux is driven by a salt-concentration differential across the membrane, not by hydraulic pressure, so a dry-started or air-locked FO element will not self-recover the way an RO membrane can after a pressure spike (PMC/NIH, 2023). That single physics fact rewrites every commissioning SOP written for RO: pump curves, flushing sequences, and CIP recipes that work on polyamide RO will damage a cellulose triacetate or thin-film-composite FO membrane on first contact.
FO systems routinely recover more than 90% of feed water versus the 75–80% benchmark for RO (Mead & Hunt), and that recovery advantage is the reason a pharmaceutical, textile, or landfill-leachate plant accepts the trade-off in the first place. The trade-offs are real: higher unit energy demand, draw-solution make-up and regeneration infrastructure, and a small set of failure modes that do not exist in RO. Two of them dominate commissioning: draw-solution dilution, which collapses the osmotic gradient before the system stabilizes, and concentration polarization, which suppresses effective flux even when the bulk ΔTDS is correct (PMC/NIH, 2023).
The irreversibility framing matters operationally. RO fouling can usually be reversed with aggressive CIP, but FO membrane dry-out or wetting-agent loss is a membrane-replacement event that costs weeks of schedule. A 2026 FO commissioning protocol is therefore organized as six phases with pass/fail thresholds, not a soft checklist.
Phase 1 — Pre-Mobilization Design Review (Weeks 4–2 Before Site Arrival)
A pre-mobilization review is the cheapest insurance on an FO project because every defect caught on paper eliminates a reweld, a remobilization, or a membrane replacement on site. The deliverables list below has to be closed out before any pipe is cut.
Require a P&ID with membrane housing orientation marked (AL-FS or AL-DS), a draw-solution circulation loop sized for 100,000–250,000 ppm TDS operation, a low-pressure CIP skid interface, and an instrument list that includes conductivity on both feed and draw sides, flow, pressure, pH, and temperature (Mead & Hunt). Feedwater characterization must include TDS, temperature, TSS, FOG, and the standard scaling indices — FO tolerates higher TSS than RO, but draw-side scaling still has to be modeled against the chosen draw salt.
Lock the draw-solution chemistry early. MgCl₂ is divalent and regenerates cleanly on a downstream draw-regeneration RO skid; NaCl is monovalent and easier to source but harder to reject; thermolytic ammonium salts unlock low-energy regeneration but force a heated loop. Each choice changes the commissioning sequence downstream, so it cannot be deferred to site. Finally, confirm membrane storage conditions: CTA and TFC FO elements ship either dry or in preservative, and shelf life plus storage temperature must be verified before mobilization because expired membranes show immediate flux loss on first wetting.
Phase 2 — Mechanical Installation and Pre-Commissioning Checks
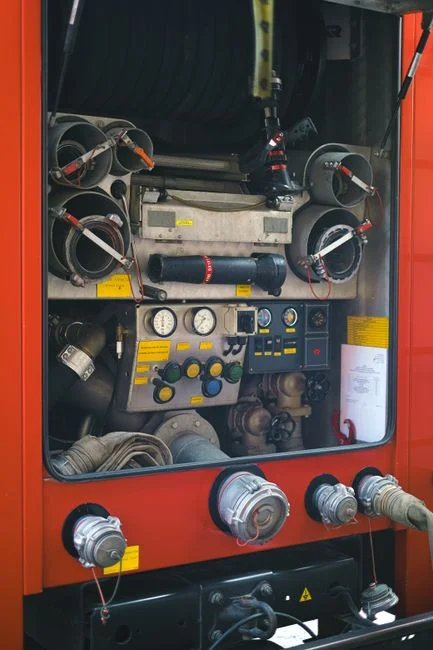
The sequence rule for FO mechanical install is the opposite of what most RO crews are trained to do: install skids, piping, and instrumentation first, and do not insert membranes until flushing turbidity is below 1 NTU and the hydrostatic leak test is complete. Welder's slag, pipe dope, and debris that an RO commissioning would tolerate flush through the system will physically foul an FO support layer.
Orient the membrane housing against the design basis. AL-FS (active layer facing feed) is the lower-fouling orientation for most wastewater duties; AL-DS (active layer facing draw) delivers higher initial flux but fouls faster (CRC Press, 2022). Wrong orientation halves flux and is not recoverable by CIP. Torque-mark the housing and photograph the alignment so operations cannot reverse it during a future element change.
Run the leak test at 1.5× design pressure on the shell side, with water or pneumatic on the lumen side as specified, holding 30 minutes with no pressure decay. Calibrate conductivity sensors against three-point standards (low, mid, 1413 µS/cm, and a high-range standard above 100,000 µS/cm for the draw side) and confirm PLC tag mapping before the draw pump is energized. The dosing-skid interface for CIP chemicals should be wired and proven through a PLC-controlled chemical dosing handshake before membranes go in.
Phase 3 — Draw-Solution Make-Up and Membrane Wetting
This is the single most FO-specific step in the entire protocol. The goal is to bring the osmotic gradient live without shocking a dry membrane or trapping air on the draw side.
Dissolve reagent-grade draw salt in RO permeate or deionized water to a target between 100,000 and 250,000 ppm TDS, confirm with the calibrated conductivity, and circulate through the draw loop at design crossflow velocity for at least 30 minutes to fully dissolve any undissolved solids (Mead & Hunt). Then submerge the new CTA or TFC elements in draw solution or feed — per the manufacturer datasheet — for the prescribed soak time, typically 30 to 60 minutes, so the support layer fully hydrates. Skipping this FO membrane wetting procedure is the most common cause of initial flux loss in the first 24 hours.
Bleed all air from the draw loop before applying crossflow. Trapped air on the draw side is the number-one cause of unstable first-day flux readings because the air pocket collapses the local ΔTDS. Run feed and draw pumps simultaneously at 30% design crossflow for 15 minutes, verify no pressure anomalies, then ramp to 60% crossflow for another 15 minutes before any flux measurement. Only then is the system ready for instrument calibration.
Phase 4 — Instrument Calibration and CIP Loop Verification
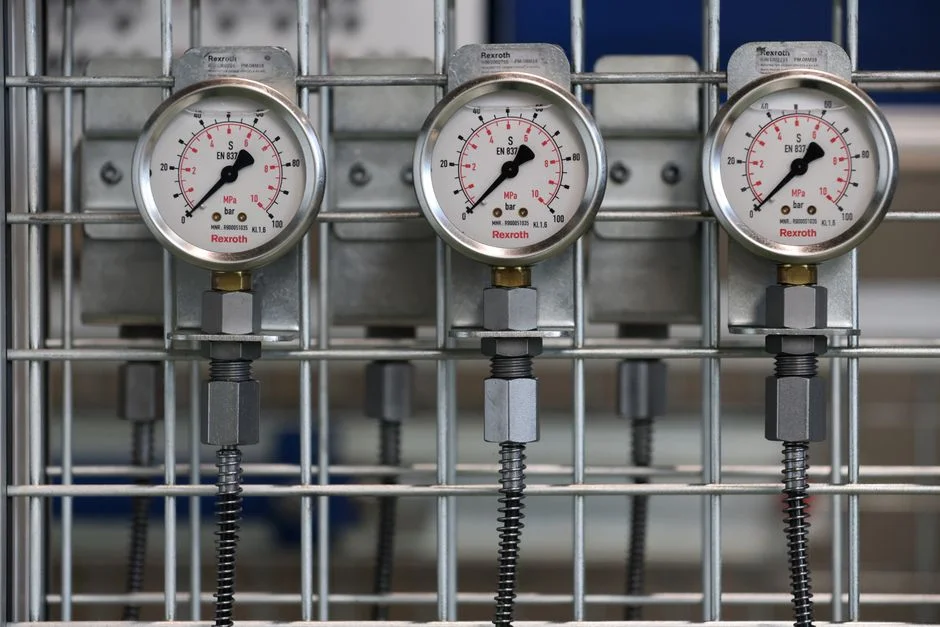
Bad data during the performance test invalidates the entire acceptance, and most of that bad data traces back to a calibration shortcut in the first 12 hours. Calibrate draw-side and feed-side conductivity on the same standard so any offset error cancels out of the ΔTDS calculation that drives the flux model. A 2% offset on draw conductivity at 150,000 ppm is a 3,000 ppm error in ΔTDS, which is enough to bias the entire 14-day performance baseline.
Walk down the CIP skid before commissioning begins. Verify chemical tanks, the rinse-water path back to drain, and all quick-disconnects against the P&ID. A missing rinse line forces a 24-hour scrub mid-startup that nothing in the schedule will absorb. Confirm a pre-treatment multimedia filter is in line ahead of the FO train, because any particulate carryover from upstream will embed in the FO support layer faster than it would on an RO element.
Test every interlock against the design basis: low-flow shutdown, high-draw-pressure trip, low-feed-pressure trip, and tank-level interlocks on both the feed and draw tanks. Log the trip setpoints. Confirm the data historian and SCADA tags trend at minimum 1-minute intervals through the ramp-up and acceptance test — 5-minute or 15-minute trending hides the short transients that diagnose concentration polarization.
Phase 5 — Staged Flux Ramp-Up Over 48–72 Hours
A defensible ramp-up curve beats a "turn it on and watch" approach every time, because the second day of an FO startup is when most membrane damage happens. The 2026 protocol splits the ramp into three stages with explicit abort conditions.
Stage 1 covers the first 12 hours at 25% of design flux. Monitor draw-side dilution rate and confirm ΔTDS holds above the design minimum — typically above 100,000 ppm draw TDS at the inlet (Mead & Hunt). Stage 2 runs from hour 12 to hour 36 at 50% flux; log the conductivity profile and watch for concentration-polarization signatures, which appear as a flux decline at constant ΔTDS (PMC/NIH, 2023). Stage 3 takes the system from 36 to 72 hours, ramping to 100% design flux only if the previous stages held stable, and records the baseline specific flux in LMH/bar for the 14-day performance comparison.
Abort the ramp and hold the current stage if any of the following trigger: more than 15% flux decline at constant ΔTDS over any rolling 6-hour window, draw conductivity collapse below the design minimum, or feed turbidity spike above the design envelope. Pushing through any of these conditions to "catch up the schedule" is the most expensive decision a commissioning engineer can make on an FO membrane.
Phase 6 — 14-Day Performance Acceptance Test
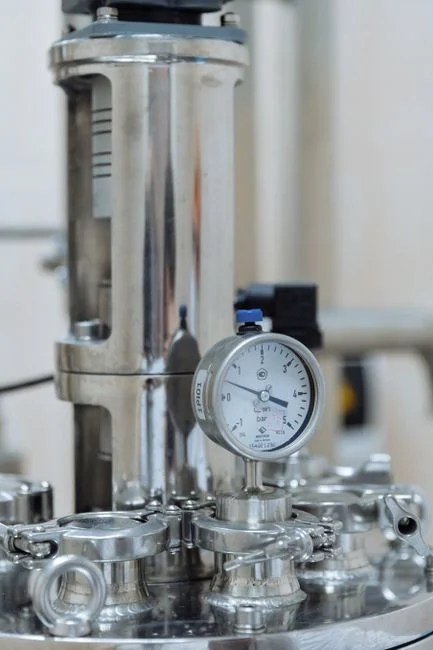
The 14-day test is the contractual handshake between the EPC, the membrane supplier, and the owner. Pass/fail criteria must be numerical and traceable to the design basis, not qualitative. The table below is the parameter set every site should trend, sign, and file in the Commissioning Dossier.
| Parameter | Target / Threshold | Source |
|---|---|---|
| Water recovery (14-day average) | ≥ 90%; <88% triggers root-cause investigation | Mead & Hunt |
| Draw-side TDS (inlet) | 100,000–250,000 ppm | Mead & Hunt |
| Specific flux stability | ≤ 10% decline week-on-week | PMC/NIH, 2023 |
| Draw-solution net loss (14 days) | 0 kg (closure verified by mass balance) | Operating-cost gate |
| Feed turbidity at membrane inlet | < 1 NTU steady, < 5 NTU transient | Design basis |
| Flux ramp abort trigger | > 15% decline at constant ΔTDS in 6 h | HydropureWater field protocol, 2026 |
| CIP frequency baseline | As required to hold specific flux; no timed CIP without evidence | HydropureWater field data, 2026 |
| Permeate TDS / regulated parameters | Continuous compliance with design basis | Project specification |
Effluent quality — permeate TDS, COD/BOD removal versus feed, and any regulated parameters such as leachate-specific metals or ammonia — must meet the design basis continuously, not only on a daily grab sample. Confirm draw-solution closure with a mass balance: any unaccounted draw salt loss destroys the operating-cost model that justified the FO selection. Package trend logs, CIP events, calibration certificates, and membrane batch numbers into a Commissioning Dossier that becomes the warranty baseline for the draw-regeneration RO skid and the FO train alike.
Common Commissioning Defects and How to Prevent Them
The ten defects below account for the majority of FO startup failures observed on industrial sites. Tape the list to the control panel during commissioning and check each one off against the relevant phase.
- Membrane dry-out because the housing was opened before flushing and wetting were complete — enforce the 30–60 min FO membrane wetting procedure in Phase 3 before insertion.
- Draw pump cavitation from undersized NPSH at startup — confirm flooded suction and full priming before energizing the draw pump in Phase 2.
- Wrong membrane orientation (AL-DS installed where AL-FS was specified) — torque-mark and photograph housing alignment at install.
- Conductivity sensor miscalibration understating draw TDS — require a 3-point calibration that includes a high-range standard above 100,000 µS/cm.
- Crossflow velocity too low, allowing particulate settling on the feed side — enforce minimum crossflow from Phase 2 onward, especially during shutdown windows.
- CIP skid connected to the wrong port, causing chemical attack on the draw loop — P&ID walkdown with operations before any CIP pump is energized.
- Air-locked draw loop producing unstable first-day flux — bleed all draw-side air in Phase 3 before applying crossflow.
- Draw-solution dilution below 100,000 ppm collapsing the osmotic gradient — confirm make-up concentration and circulation time in Phase 3 against the calibrated conductivity.
- Historian trending at 5–15 min intervals hiding concentration-polarization transients — force 1-min trends through the ramp-up and acceptance test.
- Skip of the 14-day test in favor of a 72-hour hand-off — the 14-day test is the only window that proves draw-solution closure and stable specific flux.
The same defect-prevention logic carries over to hybrid trains; the defects list in the AOP system commissioning protocol overlaps on interlocks and CIP loop integrity.
Frequently Asked Questions
How long does a full FO commissioning take from mobilization to handover?
Plan for 18 to 22 working days: 2 days for mechanical install and leak test, 1 day for draw-solution make-up and membrane wetting, 1 day for instrument calibration, 3 days for the staged flux ramp-up, and 14 days for the performance acceptance test. Any compression below this window almost always skips either the ramp-up stages or the 14-day test, and the >90% recovery figure (Mead & Hunt) is not defensible without the full window.
What is the single biggest risk during FO commissioning?
Membrane dry-out or wetting-agent loss, because both are irreversible and force element replacement rather than CIP recovery. The control is the 30–60 minute submergence soak in Phase 3, performed after the leak test and before the housing is sealed. RO commissioning SOPs, which often open housings late and start on water flush, are the leading cause of this defect on first-time FO sites.
How is FO flux stability verified during the 14-day performance test?
Specific flux (LMH/bar of effective osmotic pressure differential) is calculated daily and compared week-on-week; a decline greater than 10% indicates uncontrolled concentration polarization and triggers a CIP plus root-cause review (PMC/NIH, 2023). Recovery must average ≥ 90% across the 14 days, with any single day below 88% flagged for investigation rather than accepted as a sign-off.
Can FO be commissioned without a downstream RO regeneration skid?
Yes, if the chosen draw salt is regenerated thermally or by another non-RO method, but the commissioning sequence changes: draw-solution closure is verified by mass balance across a thermal recovery step rather than an RO permeate stream. MgCl₂ draw regenerated on an RO skid remains the most common industrial configuration, and the same sludge dewatering system comparison logic applies when sizing the reject handling downstream.