
What Is a CASS Process Flow Diagram? Definition and Purpose
A CASS process flow diagram is the engineering drawing that traces wastewater from raw influent screening through grit removal, equalization, and an anoxic selector, into a single timed CASS bioreactor that runs a repeating 4-phase cycle of fill, react, settle, and decant, and out through disinfection to a sludge handling train. The diagram fixes the unit-operation sequence, hydraulic profile, and control points so design, procurement, and O&M teams share one reference document from P&ID review through commissioning.
CASS (Cyclic Activated Sludge System) is a variant of Sequencing Batch Reactor (SBR) technology in which all biological reactions occur in a single timed tank rather than in separate, spatially distributed basins. The defining difference from conventional continuous-flow activated sludge is that CASS separates phases in time, not in space: the same tank performs aeration, anoxic contact, settling, and decanting sequentially, gated by a control clock and a directional valve tree. Three diagram families dominate the literature: standalone CASS for municipal and light industrial loads, ABR+CASS where an upstream anaerobic baffled reactor (ABR) strips carbon before the aerobic polish, and CASS paired with physico-chemical pre-treatment (coagulation/DAF) for high-strength industrial wastewater (per the figure taxonomies of S1, S2, S3, and S4). All three share the same downstream logic: a timed aerobic reactor, a moving decanter, and a sludge return/waste pair.
Headworks and Equalization: The First 5 Boxes in the Flow
Every CASS process flow diagram opens on the left with the same five headworks blocks, and the wrong aperture or wrong pump size at any one of them will cascade into selector failure downstream.
Raw influent first hits a coarse bar screen with 10–25 mm clear openings to lift out rags and large debris, followed immediately by a fine screen at 1–6 mm aperture. Skipping the fine screen is the single most common reason CASS selector zones fail in the first 12 months: inert fibers bypass the selector, accumulate in the main aeration zone, and drag the SVI above 150 mL/g (HydropureWater field data, 2025–2026). The screened stream then enters a grit chamber sized for 30–60 seconds HRT at peak hourly flow, which drops out sand and silt at 2.65 g/cm³ density before they abrade the fine-bubble diffuser membranes.
Equalization is the next unit operation and the most undersized on most first-pass diagrams. A regulation pool sized for 4–8 hours of HRT at average daily flow dampens both hydraulic surges (typically 2× average on shift-change at food plants) and load shocks (BOD peaks of 400–800 mg/L from batch discharges). Inside the equalization tank, a slow-speed submersible blender holds suspended solids in suspension — the flow meter and inlet pump downstream will read inconsistently if the upstream is allowed to stratify. The inlet pump is normally a submersible or self-priming centrifugal unit sized at 1.2× the design average flow, paired with an electromagnetic flow meter on the discharge for the PLC's totalized volume signal that drives the CASS cycle clock. Specifying a rotary mechanical bar screen for CASS headworks rated for the site's peak instantaneous flow is the cheapest insurance against the rest of the train derailing.
The CASS Bioreactor: Selector Zone, Main Aeration Zone, and the 4-Phase Cycle

The CASS tank is the box that confuses most first-time readers because it contains three distinct hydraulic regions and a clock-driven sequence of four phases that must be read together.
The reactor is divided by a baffle wall into a biological selector zone (10–20% of total tank volume) at the inlet, and a main aeration zone (80–90% of volume) on the outlet side. The selector is the bulking-control organ of the system: influent and return sludge meet there under anoxic or anaerobic conditions, with a typical HRT of 0.5–1.5 hours, so that rapidly biodegradable BOD is absorbed by floc-formers before filamentous organisms can access it. A failed selector — too small, too well-aerated, or missing entirely — produces a bulking sludge within 6–10 weeks of operation. The main aeration zone is fitted with fine-bubble membrane diffusers (typically 2–3 m submergence, 0.5–2.0 m³/h per disc) and runs at MLSS 3,000–5,000 mg/L with a DO setpoint of 2.0–3.5 mg/L during the react phase. Outside this band, either nitrification collapses (DO below 1.5) or floc shears and pin-floc escapes the decanter (DO above 4.0).
The 4-phase cycle is the technology. The table below maps each phase to its duration, aeration state, and operational purpose. Total cycle time is 4–6 hours for municipal and light-industrial loads, giving 4–6 cycles per day per basin; multi-basin designs stagger cycles to deliver continuous hydraulic throughput with batch biological treatment. The moving decanter is a floating or telescoping weir that draws from 150–300 mm below the surface to avoid scum and floating sludge during the decant phase; its speed must be limited to under 1.5 m/h of linear draw to keep the sludge blanket from being entrained (HydropureWater commissioning logs, 2025).
| Phase | Duration | Aeration | MLSS (mg/L) | DO (mg/L) | Purpose |
|---|---|---|---|---|---|
| Fill | 1–2 h | Intermittent / low | 3,000–5,000 | 0.2–0.5 | Admit influent; anoxic contact in selector; denitrify residual nitrate |
| React | 2–3 h | Full (blowers on) | 3,000–5,000 | 2.0–3.5 | BOD oxidation, nitrification, phosphorus luxury uptake |
| Settle | 0.5–1 h | Off (blowers off) | 3,000–5,000 | Falling (0.5 → 0.1) | Sludge blanket formation; no shear; TSS separation |
| Decant | 0.5–1 h | Off | 3,000–5,000 | 0.1–0.3 | Moving weir draws clarified supernatant; waste sludge withdrawn at end |
For broader context on how this timed-cycle logic compares with continuous anaerobic treatment, the anaerobic digester working principles guide covers the upstream carbon-removal side of a hybrid ABR+CASS train.
Sludge Return, Wasting, and the Internal Recycle Loop
The two arrows on the right side of a CASS flow diagram — return and waste — are the control valves that determine whether the system runs at steady state or slowly drifts into bulking or washout.
The internal return line recycles settled activated sludge from the bottom of the main aeration zone back to the selector inlet. The return rate is typically 20–30% of the forward inflow, sized to maintain a food-to-microorganism ratio (F/M) of 0.05–0.15 kg BOD/kg MLSS·day. Below 0.05 the biomass starves and pin-floc appears in the effluent; above 0.15 the selector loses its substrate gradient and filamentous growth resumes. Gravity return is most common because CASS reactors are shallow (4–5 m side-water depth) and the selector is normally at the same elevation as the main reactor floor; pumped return is used only when the selector must be elevated or the return ratio must be modulated by PLC for biological phosphorus removal.
Waste activated sludge (WAS) is bled from the reactor bottom during the last 10–15 minutes of the settle phase, at a rate of 0.3–0.8% of daily throughput for industrial loads and 0.5–1.0% for municipal loads. Over-wasting drops MLSS below 2,500 mg/L, after which effluent TSS rises sharply because the sludge blanket is too thin to act as a polishing layer. Under-wasting pushes MLSS above 6,000 mg/L, which raises the SVI above 150 mL/g and triggers rising sludge in the decanter. Both failure modes are visible on the diagram's WAS control valve position, which is why a properly annotated CASS P&ID always shows the WAS valve with both a manual setpoint and a PLC-modulated override. Operating cost benchmarks for the downstream solids train, including WAS thickening, are detailed in the lamella clarifier OPEX for CASS polishing breakdown.
Effluent Polishing and Sludge Handling: The Final 3 Boxes
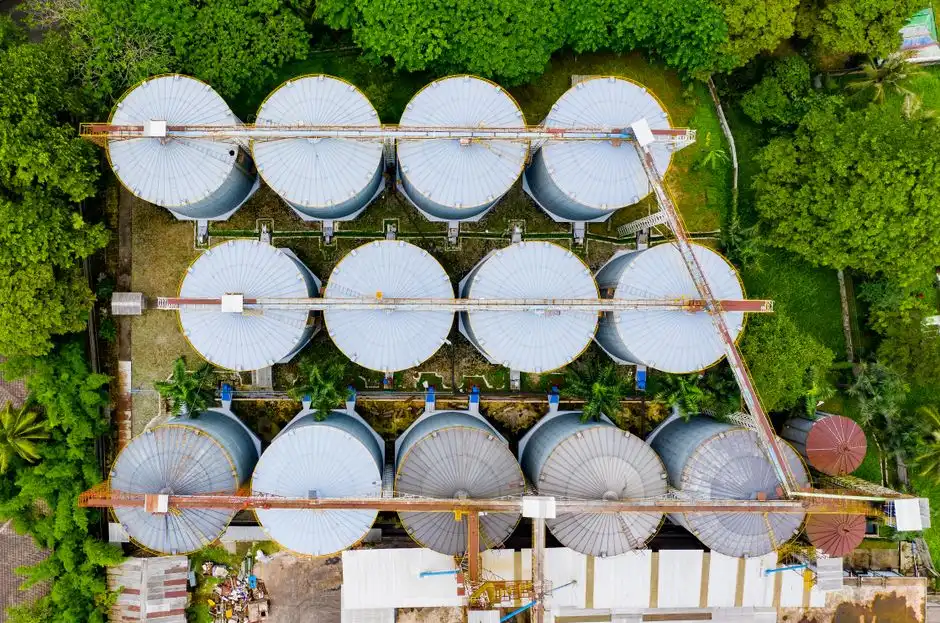
Completing the flow train, the CASS diagram's right-hand side shows three downstream blocks that turn the batch-decanted supernatant and the wasted sludge into dischargeable and disposable end products.
Effluent from the moving decanter passes through disinfection — typically a ClO₂ disinfection for CASS effluent contact tank with 15–30 minutes HRT to meet coliform targets of 200–1,000 CFU/100 mL for surface-water discharge, or a UV bank at 30–40 mJ/cm² dose for water-reuse applications. Industrial CASS plants with variable influent (food processing, tanneries, textile dyeing) typically add a DAF polishing unit downstream of the CASS reactor to lift final TSS to under 10 mg/L, because the CASS decanter alone struggles below 15–20 mg/L on shock-load days.
Waste activated sludge from the reactor bottom and DAF float are combined in a sludge holding tank, then thickened on a rotary drum or gravity belt to 4–6% dry solids, and finally dewatered with a plate-and-frame filter press for CASS waste activated sludge to reach 20–25% DS cake for landfill or incineration. Filtrate from the press returns to the headworks, so the dewatering unit's hydraulic load must be included in the equalization sizing — a 5,000 m³/day CASS plant typically generates 30–50 m³/day of filtrate that re-enters the train.
CASS Design Parameters at a Glance
The table below consolidates the operating windows quoted in the preceding sections into a single reference a design reviewer can pin to a wall during HAZOP or commissioning. Ranges are typical for 10–5,000 m³/day municipal and light-industrial CASS plants; values outside the listed failure-mode column are the early warning signs to look for in the SCADA trend.
| Parameter | Typical Design Range | Unit | Common Failure Mode If Out of Range |
|---|---|---|---|
| MLSS (main aeration zone) | 3,000–5,000 | mg/L | Below 2,500 → effluent TSS rises; above 6,000 → SVI climbs, rising sludge |
| HRT (total reactor, at avg flow) | 16–24 | h | Below 12 h → nitrification incomplete; above 30 h → endogenous decay, poor floc |
| F/M ratio | 0.05–0.15 | kg BOD/kg MLSS·d | Below 0.05 → pin-floc, effluent TSS; above 0.15 → filamentous bulking |
| DO setpoint (react phase) | 2.0–3.5 | mg/L | Below 1.5 → nitrification fails; above 4.0 → floc shear, high TSS |
| Total cycle time | 4–6 | h | Below 4 h → settle phase too short, decanter pulls sludge; above 6 h → capacity loss |
| Selector volume fraction | 10–20 | % of tank | Below 10% → bulking in 6–10 weeks; above 20% → wasted aeration volume |
| SVI target | 80–150 | mL/g | Above 150 → rising sludge; above 200 → clarifier failure, decant pollution |
| Design BOD loading rate | 0.15–0.30 | kg BOD/m³·d | Above 0.30 → incomplete BOD removal and ammonia breakthrough |
| Return sludge rate | 20–30 | % of inflow | Below 20% → F/M drift, bulking; above 30% → selector short-circuiting |
| WAS rate (industrial load) | 0.3–0.8 | % of daily flow | Under-wasting → high SVI; over-wasting → MLSS collapse |
For a project-level view of how these CASS numbers compare with a packaged MBR alternative in similar flows, the MBR vs extended aeration comparison guide gives a directly comparable design table.
Choosing CASS vs MBR vs SBR for a New Plant
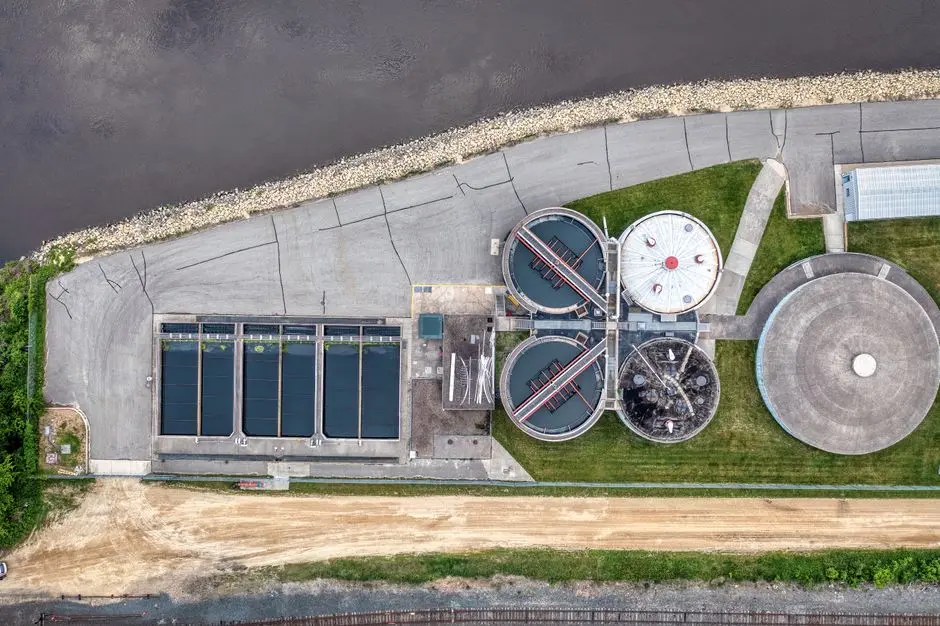
CASS is one of three SBR-family options an engineer should weigh at the conceptual stage, and the right choice depends on effluent quality targets, footprint, and operator skill rather than on the biological kinetics alone.
CASS has 30–40% lower CAPEX and roughly 60% smaller footprint than a conventional continuous-flow activated sludge plant of the same capacity, but slightly higher OPEX than a packaged MBR because MBR eliminates the separate clarifier and lets MLSS run at 8,000–12,000 mg/L. MBR delivers effluent TSS below 1 mg/L because of the submerged ultrafiltration membrane (typically 0.1–0.4 μm pore size) and is the right answer when the water is destined for reuse or discharge to a sensitive receiving body. CASS is preferred when effluent discharges to surface water or municipal sewer at TSS 10–20 mg/L and BOD 10–20 mg/L — a band the standard moving decanter can meet without membrane replacement cost. For very small flows under 50 m³/day with intermittent loading (rural communities, hotels, resort camps, small factories), a WSZ package plant alternative for small CASS applications is usually more economical than a custom CASS build. The comparison below is the one I walk clients through at the proposal stage.
| Criterion | CASS | MBR | Continuous Activated Sludge |
|---|---|---|---|
| Effluent TSS (mg/L) | 10–20 | < 1 (membrane) | 10–30 |
| Footprint | Small | Smallest | Largest (1.6× CASS) |
| CAPEX (10–5,000 m³/d) | Low | High (+25–40%) | Lowest |
| Operator skill required | Moderate (timer-based) | High (membrane cleaning) | Low |
| Reuse-ready effluent | No (unless polished) | Yes | No |
Direct head-to-head CAPEX/OPEX numbers for MBR versus extended-aeration alternatives are broken down in the MBR vs extended aeration comparison reference. For regional guidance on packaged plant selection, the package wastewater treatment plant selection guide gives state-specific cost and compliance benchmarks.
Frequently Asked Questions
What is the typical CASS cycle time for a municipal or industrial plant?
Total CASS cycle time is 4–6 hours for municipal and most light-industrial loads, with each cycle running fill (1–2 h), react (2–3 h), settle (0.5–1 h), and decant (0.5–1 h). Multi-basin designs stagger the cycles to deliver continuous hydraulic throughput with batch biological treatment (HydropureWater field data, 2025–2026).
What MLSS and DO setpoints should a CASS reactor run at?
Main aeration zone MLSS is 3,000–5,000 mg/L with a DO setpoint of 2.0–3.5 mg/L during the react phase. Outside this band, DO below 1.5 mg/L collapses nitrification and DO above 4.0 mg/L shears floc and lifts effluent TSS above 20 mg/L (HydropureWater commissioning logs, 2025).
How is waste activated sludge handled from a CASS reactor?
Waste activated sludge is withdrawn from the reactor bottom during the last 10–15 minutes of the settle phase at 0.3–0.8% of daily inflow for industrial loads, then thickened to 4–6% DS and dewatered on a plate-and-frame filter press to 20–25% DS cake for disposal. Filtrate from the press returns to the headworks, so its hydraulic load must be included in the equalization sizing.
Is CASS the same as a standard SBR?
CASS is a patented variant of SBR technology that adds a baffled biological selector zone at the inlet of the reactor to suppress filamentous bulking. A generic SBR has no selector, which is why CASS plants tolerate higher and more variable organic loads than standard SBR designs at the same MLSS.
Is CASS suitable for industrial wastewater, or only municipal?
CASS is widely used for industrial wastewater in the 10–5,000 m³/day range, including food processing, brewery, textile, pharmaceutical, and landfill leachate applications, provided influent BOD is under 1,500 mg/L or is preceded by an ABR or DAF pre-treatment step. For high-strength industrial effluent above 1,500 mg/L BOD, an ABR+CASS or DAF+CASS combination is the standard configuration (per S1 and S2 figure taxonomies).